This post covers a free online avalanche observation tool to detect avalanches and avalanche terrains. This tool is called “Avanor“.
We all know that an avalanche is heavy snow that falls rapidly from the mountains on the ground. Avanor can detect reflections from the snow and give you data marked with different colors like blue, green and red. These colors indicate if there has been an avalanche or if the snow is stable on the ground in a particular area. This tool uses the data of Sentinal-1, SAR, GRD satellites.

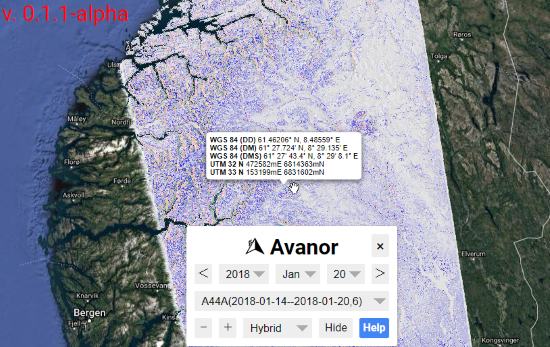
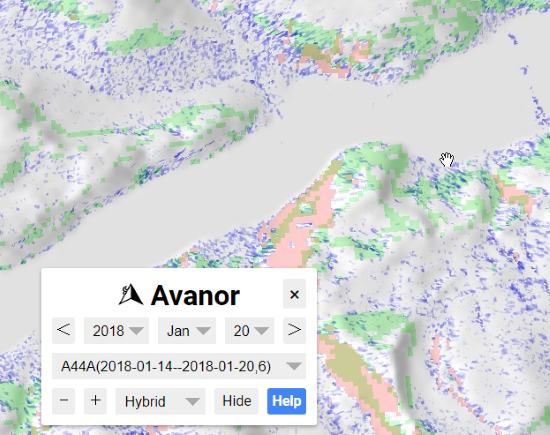
Avanor images have timelapse of 6-12 days. Which means the report will show you the data for last 6 days based on the date selected by you. You can also click on the particular area to see the coordinates information. You can see in the above image how it indicates different colors for an avalanche.
This tool covers the Norway area only, but you can request them via email if you want to get the coverage of some other area. At present, the tool is in alpha mode and it is not proven if it works accurately. Still, it has some good details related to avalanches so it is a nice option to try.
Using online Avalanche Observation Tool to Detect Avalanches, Avalanche Terrains:
To observe the data on Avanor, one has to select the date in the date selector. Since the tool shows you the data of last 6-12 days from the selected date. It is not necessary that the data on a map is of the date you selected. For example, you can see in the above image, I selected the date 20th January and it does not show the data of that exact date but shows the data for the last 6 days from (14-20 January).
You can also change the view of map to Roadmap, Satellite, Hybrid, Terrain. The above picture has the view of hybrid in the background.
You can view the coordinate system of an area. For this, I clicked on the map and then a pop-up appears with relevant coordinates for the area. The WGS system is showing the global system with the UTM zone as you can see in the above image.

To understand the map of avalanche observation, you need to understand the indications provided by different colors, which are as follows:
- When you see the occurrence of changes in an avalanche on the ground, you will see the blue color. If you find the blue color in scattered form on the map, it means there is some noise of avalanche in that area.
- When there is a possibility of avalanche terrains, then it is indicated with green color. Avalanche terrains start with 20-35 degree angle. When the area has avalanche terrain between 30- 40 degrees, then it will show you green color on the map.
- Sometimes a place can encounter heavy snow storms. Due to this change in the atmosphere, the satellites might not detect the area. Also, the steep slopes may not be visible to the satellite. In this case, the map will show you areas marked in red color.
You can also read this article to get earthquake alerts.
In brief
Avanor is a good tool through which you can observe avalanches and detect terrain just by different color indications. It uses Sentinal-1, SAR, GRD Satellites data to find reflection on the ground. However, it is pre-release version so the report might not show you the accurate data.
Try this out.