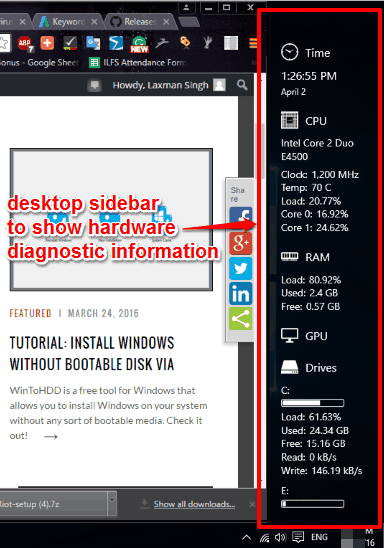
Here comes a free desktop sidebar to monitor RAM, drives, and CPU usage in real-time. The name of this software is “Sidebar Diagnostics“. It works as a desktop widget that provides a sidebar and shows hardware diagnostic information on that sidebar. It shows read and write speed of hard drives, clock speed, and core usage percentage for CPU, and RAM load (including used and free space) in that sidebar. It can also show network information (Wireless Network Adapter name) and GPU information, if possible.
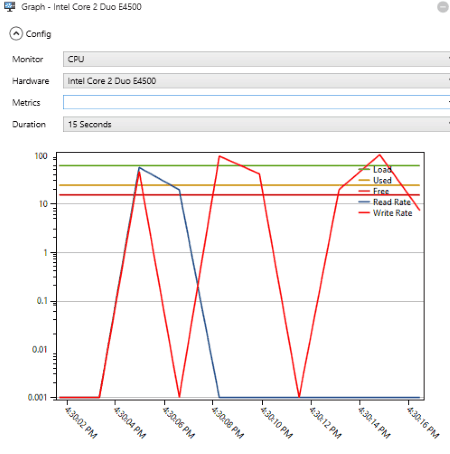
Apart from this, you can also access its feature to plot real-time graph for network, CPU, RAM, drives, GPU, and network usage. You can’t save graph or other information, but it is really useful for real-time analysis.
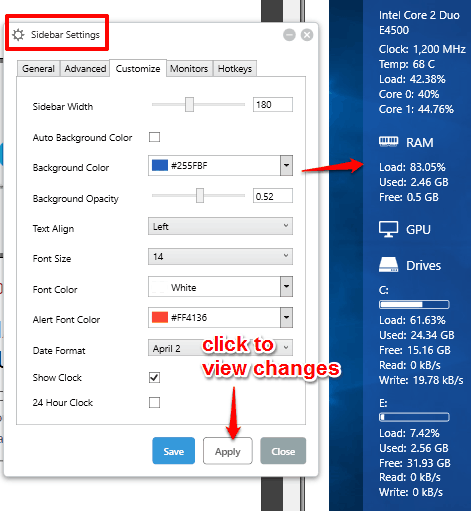
By default, the sidebar has a fixed width, height, and color. However, you can access Settings to change background color, opacity, sidebar length, etc.
Above you can see the hardware diagnostic information visible in the sidebar of this software. This software is also compatible with Windows 10.
You may also check some free system information viewer software reviewed by us.
Use This Desktop Sidebar To Check CPU and RAM Usage and Other Hardware Diagnostic Information:
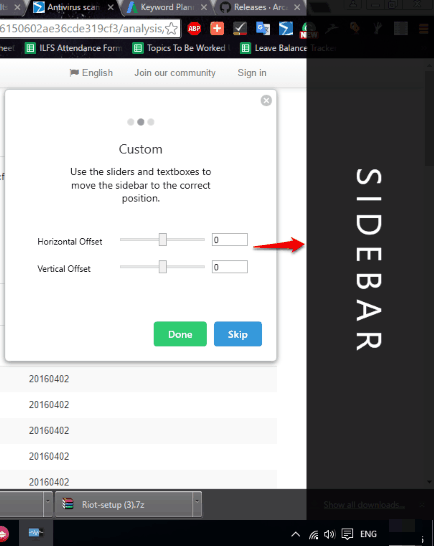
Here is the link to download this software. When launching it for the first time, you need to follow the initial setup, which is helpful to make sidebar visible, set its horizontal and vertical offset, etc.
When its sidebar or menu bar is visible at the right side of your desktop screen, then you will be able to see the information related to:
- CPU: Clock speed, temperature, Cores percentages, and load.
- RAM: Load in real time, used and free space.
- Drives: Used and free space, Read and write speed, and load or pressure in percentage.

- Network Adapter Info.
- GPU
Plot Network, Drives, CPU and RAM Usage In Real-Time:
The menu bar or sidebar of this software contains a Graph icon on the top part. Clicking on that icon opens a window. Using that window, you can select the item that you want to monitor, set metrics (like clock, temperature, load, etc.), and time to plot graph automatically and regularly.
Customize Sidebar Appearance and Other Settings:
Just next to Graph icon, you can see Settings icon. Use that open to access Settings window and then you will be able to:
- Set the position of sidebar (left or right).
- User Interface scale, horizontal and vertical offset, etc.
- Set sidebar width, background color and opacity, font size and color, and more.

Changes are not visible in real-time. You need to click on Apply button to view the changes.
The Verdict:
Sidebar Diagnostics is really good for all those users who need to monitor their hardware performance in real-time. You can just activate the sidebar of this software and monitor CPU and RAM usage, Drives read & write speed, etc., and continue with your work side by side.


