This article includes 5 websites to make scatter plots online.
A scatter plot is a mathematical diagram that displays two variables. With dot representation, it shows the values of two variables on a graph plotted along x-axis and y-axis. A scatter plot is used to show how two variables are affected by one another.
Here are 5 free websites to make scatter plot online. The websites mentioned here can easily make scatter plot online with a few clicks. Most of these websites offer various style options to let you customize the look of the chart. You can choose a color scheme for the chart and select font face for labels. You will also get two choices to for the plot on these websites. You can make the plot scattered or you can make it connected to see the effect of one variable on another.
Also read: 5 Online Histogram Maker Websites Free
Here Are 5 Free Online Scatter Plot Maker Websites:
ScatterPlot.online
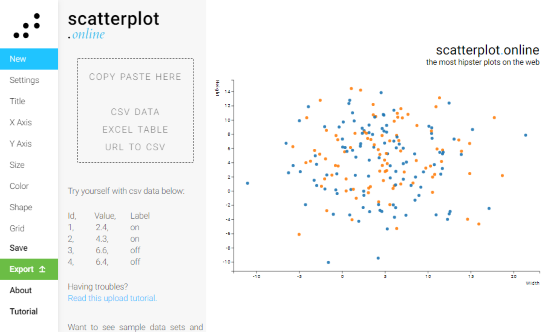
ScatterPlot is a free web application to make scatter plot online. It has a straightforward user interface with a navigation bar on the left. This navigation bar has various scatter plot chart parameters. You can jump to any parameter from here and personalize them as per your needs.
To make a scatter plot here, select the New option and add your data. You can manually enter your data or import it from a CSV file, Excel table or a CSV URL. Once, you do that, this tool generates the scatter plot for your data. After that, you can customize the chart to best fit your need. You can change its appearance, color scheme, and margins. You can add labels and select a font face for them from the given options. To make the chart information-rich, you can add a fit line, grid, legend and set the limits for the X and Y axis. In the end, you can export the scatter plot chart as a PNG or SVG file.
You can try this online scatter plot maker here.
Plot.ly
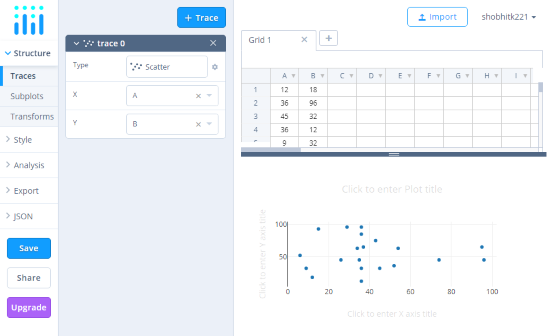
Plot.ly is an online graph maker tool where you can make scatter plot, bar graph, line graph, area graph, heatmap, table, histogram, and more. Similar to ScatterPlot, this tool has a navigation bar on the left. To make scatter plot here, go to the Structure -> Trace and select “Scatter“. After that type your data in the sheet. You can directly paste your data here or import from an Excel, CSV or SQL file. Then select the variables for the scatter to make the scatter plot.
This tool makes a scatter plot from your data representing all the values of both variables. For data analysis, you can connect the dots to one variable’s effect on another. You can also plot a mean line for both value sets. After making the desired changes to the chart, you can save it to your Plot.ly account and share online. You can also export it as a PNG or HTML file.
Give this online scatter plot maker a try here.
Meta-Chart.com
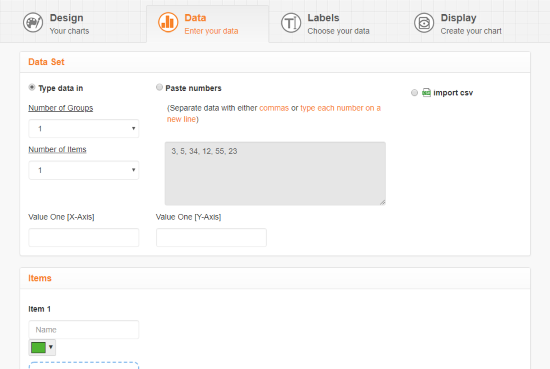
The next online scatter plot maker website on this list is Meta-Chart. With this website, you can easily make scatter plot online within three simple steps. The first step is Design. In this step, you can set various design parameters for the scatter plot. You can set background color, border color, and add legends. The second step is Data where you have to enter the data inputs for the scatter plot. You can type data for each variable manually, name it and choose a color. Or, you can directly paste your data or import from a CSV file.
The third step is for the labels. In this step, you can add names for axis labels and chart, select a font face, color, and size. After all these steps, this website makes a scatter plot from your data; you can preview it in the Display section. From there, if everything is as you wanted, you can download the chart to your computer. Otherwise, you can go back to any step and make the desired changes.
You can try this online scatter plot maker here.
OnlineChartTool.com
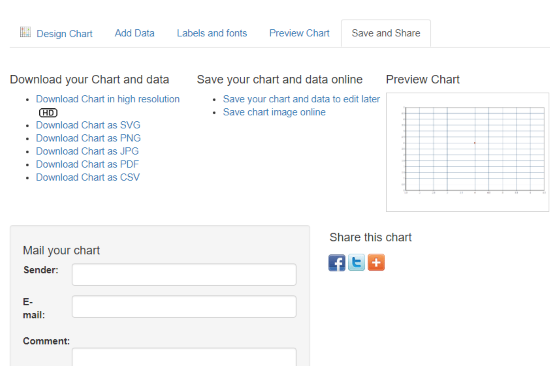
OnlineChartTool lets you make various types of charts using its online charting and general data visualization techniques. Just like the Meta-Chart, this website also has a simple 3-step process to make scatter plot; Design, Data, and Labels.
In the Design, you can select a style for the scatter plot and choose the background, dot, and line colors. You can also set margins in all side and a gradient and transparency effect on the chart. In the Data, you can add data manually or import CSV file. You can also color code the variables and add mark lines as well. Then, you can add labels for the chart and make a scatter plot. This website shows you a preview of the chart which you can download as a SVG, PNG, JPG, PDF, or CSV file.
Here is the link to try this online scatter plot maker.
Shodor.org
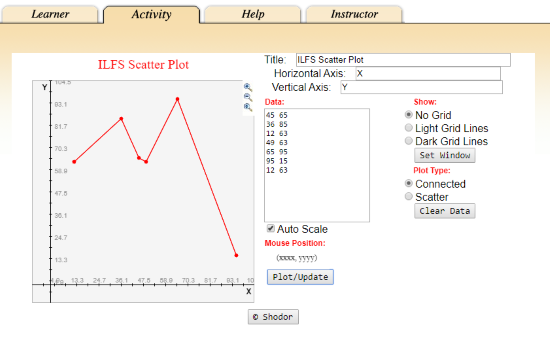
Shodor provides a free online tool where you can represent your data on various types of chart. Instead of offering heavy customizations, this tool helps you quickly detail-rich charts. In case of scatter plot chart, you can directly paste your data here and plot it on the graph. You can name the axis and grid lines to the chart. This tool also has an option to make the plot scattered or connected. This way, you can quickly visualize your data on a chart here. In case, you need the chart, you can right-click on it and save it as an image from the context menu.
Try this online scatter plot maker here.
Closing Words:
So I was able to find these 5 free online scatter plot maker websites. All of the websites work well and can be used to quickly make scatter plots and customize them to fulfill your requirements.