A Radar chart is a way to compare multivariable data on a polar grid. It represents the variables on the axes with a common starting point on a two dimensional graph. In the radar chart, the distance and angle between the axes is typical uninformative.
In this article, I covered 3 free radar chart maker software for Windows. With the help of these software, you can easily make radar chart right on your computer. The first software is an easy tool to quickly make radar charts with a limitation of up to 12 data cells. Whereas the rest two software are more versatile where you can import data from various types of documents files without any data cell limitation.
Also read: 5 Free Online Radar Chart Maker
3 Free Radar Chart Maker Software For Windows:
Free Graph Maker

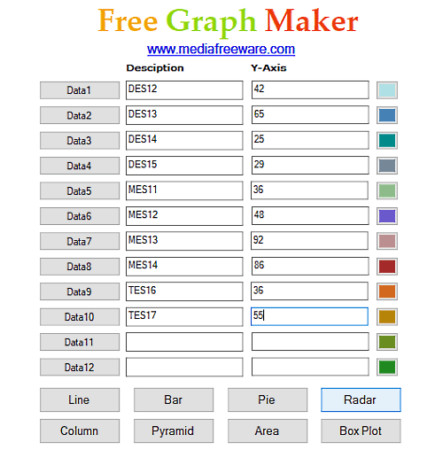
As the name suggests, Free Graph Maker is a free software to make various types of graphs. Along with the Radar Chart, you can use this software to make Line, Bar, Pie, Column, Pyramid, Area, and Box Plot chart as well. When you open this software, it gives you a data grid where you can input up to 12 data values for the chart. In that grid, you can enter the values along with descriptions (or names). You can also choose a color for each value and make the data color coded.
After entering the values, simply click on the Radar chart button below the grid. Once you do that, this software generates a radar chart for your data input. From there, you can save that chart as a JPG image file or print it to PDF.
Download this free radar chart maker software from here.
Gnumeric Spreadsheet

Gnumeric Spreadsheet is a free spreadsheets software where you can manipulate and analyze numerical data. In this software, you can open CSV, HTML, TXT, DIF, XLS, DBF, ODS, PX, DB, and other documents file formats and performs various operation on the data.
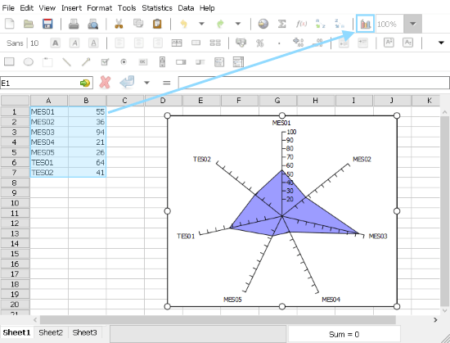
To make radar chart with this software, simply add your data in the spreadsheet. Type the data names/descriptions in one column and data values in the next column. Then, select both the columns and click the Chart options from the top right corner. In the Chart options, you get Radar Plots, Radar Plots with Dots, and Area Radar Plot options for the radar chart. Select the desired radar plot option from there and drag the cursor on the spreadsheet to select an area for the chart. Once you release the mouse cursor upon drag, this software adds a resulting radar chart to the selected area. After making the radar chart, you can save it in the spreadsheet, print it to PDF, or save it as a PNG, JPEG, or SVG file.
You can download this free radar chart maker software from here.
SoftMaker FreeOffice

The next free Radar Chart Maker software on this list is SoftMaker FreeOffice. It is a cross-platform office suite software available for Windows and Linux. When you download this software, it asks you to enter an email address where it sends the product key for the software. Upon installation, you have to enter that product key in order to use the software.
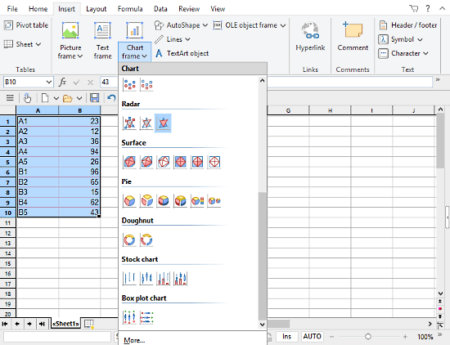
The process of making the radar chart with this software is same as of the Gnumeric spreadsheet. All you have to do is enter your data names and values in the two adjacent columns. Then, select all the values in both those columns and go to the Chart frame option from the top ribbon. From the Chart frame option, choose a radar plot and drag an area on the spreadsheet for the chart. As you do that, this software inserts the resulting radar chart on the selected area on the sheet. From there, you can save the chart in the spreadsheet or export it as an image or PDF file.
Download SoftMaker FreeOffice to make radar chart here.
Closing Words:
These are the 3 free radar chart maker software for Windows. In these software, all you have to do is input your data and they make the radar chart for you. Then, you can save the radar chart as PDF or image file and use it wherever you intended to.