RAS Graph & Stats is a free portable network monitoring software for Windows which you can use in order to keep track of your dial-up, cable modem and ADSL connections. It uses graphs and detailed statistics about network speed, internet speed, keeps track of data transfer, both upload and download and it does all these things from inside the system tray. It’s a great network manager alternative for Windows.
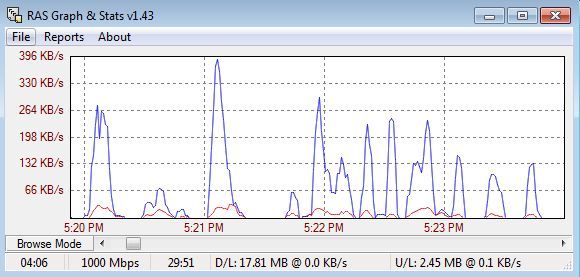
Down below you can see how the window of the network activity graph looks like. There’s something called the Browse Mode, that you can activate, that let’s you browse through a graph of the entire duration of the internet connection. Bandwidth usage for every minute that the connection was active is drawn out on the graph. Using the horizontal scroll bar at the bottom you can control how far back in time you go.
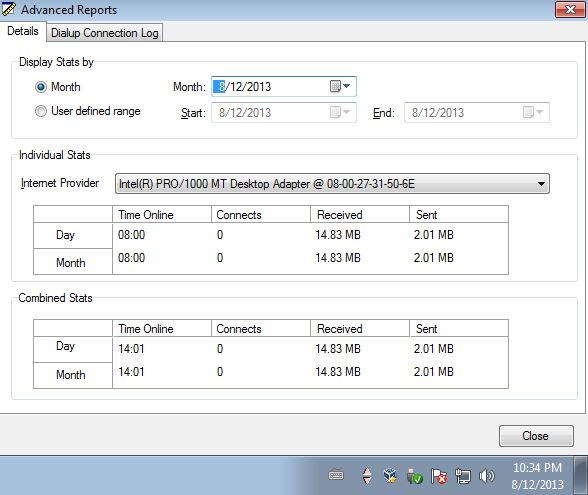
With this portable network monitoring software you also get an additional “Advanced Reports” window that can be used to go over even more details about active network connections, for example the number of connects, total time online, amount of transfered data and more.
Key features of RAS Graph & Stats are:
- Free and simple to use: easy to setup network monitoring utility
- Portable: does not require installation, just click on the executable
- Quick network adapter select: select which adapter will be monitored
- Keep track of network speed, bandwidth usage, data transfer, time online
- Detailed graphs and reports for every minute that connection is active
- System tray icon: system tray icon that has an activity indicator
- Works with all versions of Windows: starting with Windows XP
Similar software: SterJo NetStalker, ICSI Netalyzer, Faye Tracker.
System tray icon/activity indicator that was mentioned in the feature list above is the same to the one that can be found in Windows XP. There’s two arrows on the system tray icon, and whenever upload is active, one side blinks, and when download is active, the other side blinks.
How to keep track of network activity with RAS Graph & Stats: free portable network monitoring software
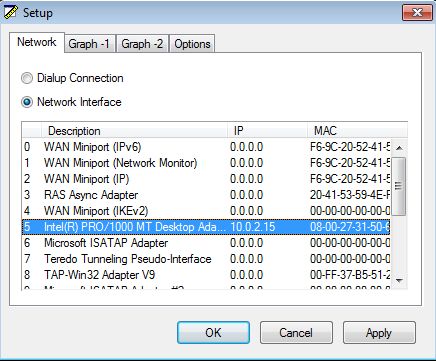
There’s nothing much that you need to do other than click on the downloaded executable. First you’re gonna see a network adapter selector.
Here you can switch between wireless and ethernet, for example. Once that network adapter is selected, first the windows with graphs will come up, the one that can be seen on the first image from the top, alongside the system tray icon.
If you click on Reports >> Advanced, you will see this window on the image above where you can check in greater detail status of your network activity. Use the dropdown menu to change the connection type, and the date filtering tool at the top to select a different time frame. Notice also the system tray icon in the bottom right corner.
Conclusion
For a portable network monitoring software, RAS Graph & Stats has a lot of interesting ways how it can help you keep track of your network usage. It works alongside the default Windows network manager, so you can run both of them at the same time.


