Graph Converter Lite is a free raster graphics vectorization software which you can use to convert charts that you have drawn on a piece paper into electronic form which can be used by other computer applications. The graph’s data point table can be created automatically, in which this free graph conversion software calculates the values on its own, or you can do it yourself manually.
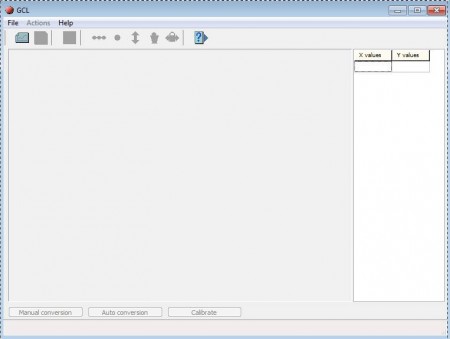
Interface of this free raster to vector graph conversion software can be seen in the image above. Graphs that you open will be imported to the large empty area on the left, while the calculated table of values of the graph is gonna be placed in the right sidebar. Top menu holds everything that you need for graph conversion.
Key Features of Graph Converter Lite are:
- Free and simple to use interface, easy to figure out.
- Only works with BMP raster image format, used by scanners.
- Automatic and manual calculation of the graphs value table.
- Save the created table of value as TXT or export Excel file.
This type of conversion is very useful when you want to turn your existing graphs, the ones that you’ve drawn in your notebooks during classes in school, to electronic form. Scan your graphs notebook with your scanner, make sure that it’s a good scanner and then open the generated file in Graph Converter Lite. Good scan without any kind of artifacts improves the accuracy of the automatic graph converter.
How to Convert Hand Drawn Graphs to Vector graphics with Graph Converter Lite?
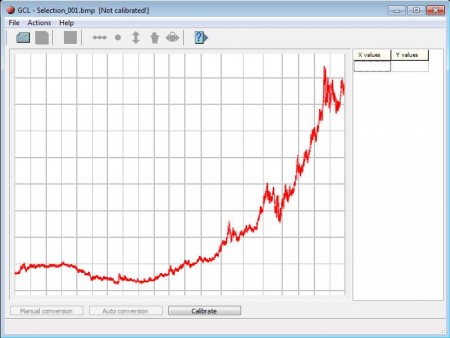
Start by opening the scanned document. BMP files only can be opened. You’re gonna have to convert it to JPEG, if JPEG is what your scanner is using. With the document scan opened, you should see something like this:
In this image you can see that we have opened a graph and we need to start the transformation from just this line to something that can be used by other software and application. Use your mouse and click on the begging of the graph in the bottom left corner. A small window asking for the value will pop-up. There enter the value which the created point should have in the graph.
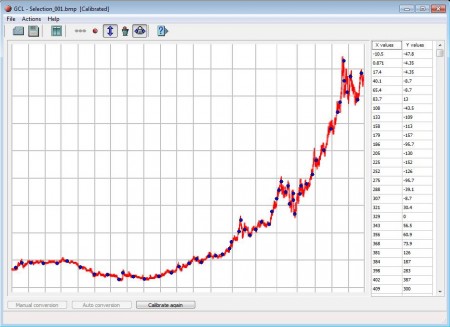
Repeat the processes for two more points. When you’re done click on either Auto Conversion for the rest of the points to populate on its own, or you can click on the Manual conversion so that each one of the points can be converted manually. Do this with the red Add point tool at the top. As you are creating graph points, values in the right sidebar should change according to the three previously set marker values. When you’re done setting everything up, click on File >> Save or File >> Export depending on what you want to do.
Conclusion:
Graph Converter Lite is a very useful tool which you can use to turn old hand drawn graphs to digital graphs. Try it out and just see how useful it really is. You may also try Chart Creator, Graphs Made Easy, and yEd Graph Editor reviewed by us.


