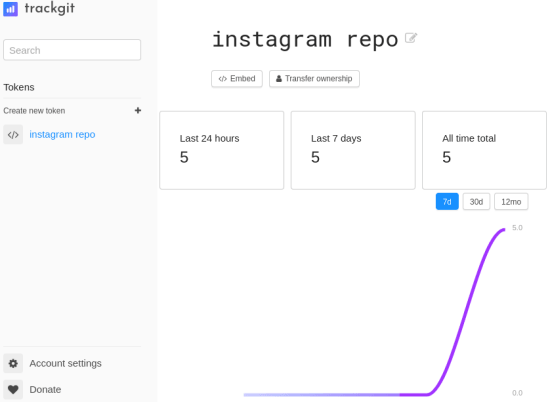
trackgit is a free GitHub analytics tool to track visitors on git repositories. Think of it as Google Analytics for your GitHub and works pretty much like. However, it only shows number of visits on the dashboard. It also adds a visit counter indicator in the readme of your repository. On the dashboard, you can see the views in last 24 hours, in last 7 days, and overall views of all time. Here you can add the views counter on multiple repositories and track view from a same interface. On the main dashboard, it even sketches a graph for you to visualize the traffic.
GitHub does not provide you analytics for your repository by default. Which is why you will have to rely on some third-party tools in order to track traffic on your repositories. And one of the tools is I have mentioned here that does a very good job at that. You just have to add a simple HTML code in the readme of your project and then it will take care of the rest. After creating a free account, you can track the visitors or views on the main dashboard. You can add the analytics on multiple repositories and keep an eye on the traffic from a single dashboard.
Free GitHub Analytics Tool to Track Visitors on Git Repositories
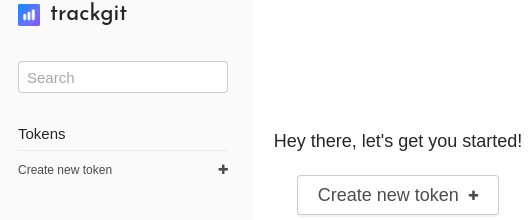
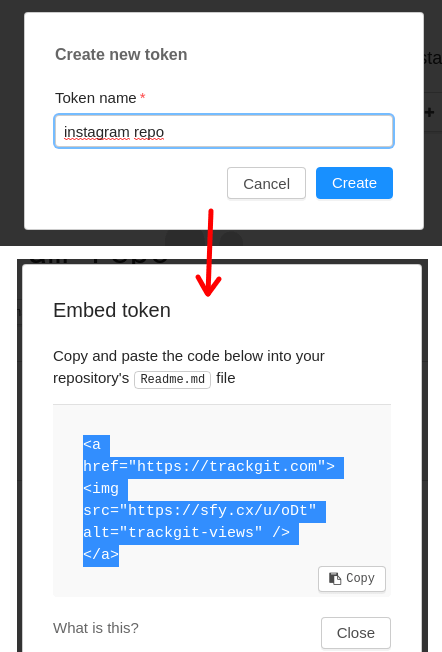
Getting started with trackgit very simple. You just have to sign up for a free account on its main website from here. After verifying the email, you are all set. After verifying your emails, you will reach the main dashboard where you will have to create something called a token. And token is basically nothing but just are distinguishable property for a repository that the tool will generate tracking code for.

After specifying name for your token, it will just show you the code that you have to add in the project readme. You go to your project now and simply edit the readme file. Add the tracking code that you have already generated.

Just add the code on the top of the readme document. Commit the changes and that is it.
![]()
From now on, you will start receiving the traffic stats on your GitHub repository. And you can see that all from the dashboard. You can see in the screenshot below. On the dashboard, you can see the traffic stats in the last 34 hours, last week, and overall views.

In this way, you can use this simple and free GitHub analytics tool to track traffic stats on your GitHub repos. You can create many tokens for different GitHub repositories and track all the views right from the simple dashboard. This is as simple as that.
Closing thoughts
There are not so many tools for the term analytics and the one I have mentioned here is fantastic. It is simple straightforward, and kind of must-have tool for open source developers. It can help to track how many views or traffic their projects getting. I really liked the way it works and I hope in future updates, they add some more features in it such as location and device information. Till then, you can just use what it has to offer now and let me know what you think about it.