yEd Graph editor is a versatile tool, which can be used to depict the flow of information expertly. The software is a very intuitive application, for representing information in pictorial form. By using this editing software, you can create graphs, illustrative diagrams, trees, flow charts, networks and many other visual representations.

The interface design
There are not many Graph editing tools out there, which can offer all the services that you may need! The presence of multiple tools in a software will obviously make it a bit complex. I found the interface quite intriguing to use at first, but after using the software for a couple of times, you pretty much get used to it. For a beginner, the variety of tools that are available; may cause slight confusion. It will take some time to use these tools properly, for obtaining the desired result. There is a help file kept in there to help you with the operation of these tools.
Grid and Snap tools are a must for any designer these days! yEd has a good grid option, simple zoom operation; which can be used with the scroll button of the mouse, label positioning and alignment. Simple details have been paid great attention to, by the developers.
Creation of diagrammatic illustrations

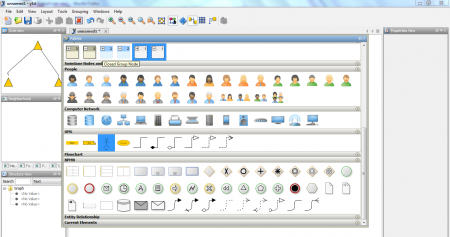
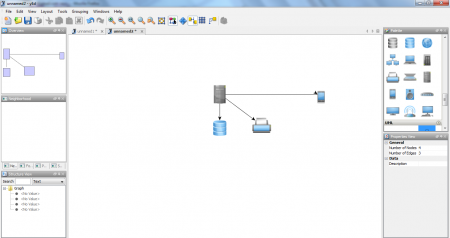
Simplicity of operation, is definitely the strong point of this software. You just have to drag and drop the various symbols, to create the desired illustrations that you may require! Apart from the connecting lines and mathematical symbols, you can even incorporate other figures. For those who want to depict UML presentations, actors and other roles can be easily assigned by choosing the UML option. Even computer networks can be depicted by selecting and dragging the various network nodes, provided in the Palette area. The ever so complex feature of business methodology can be easily illustrated with BPMN symbols.
The versatility of the software
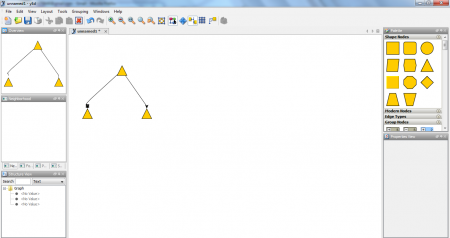
It’s not about only creating diagrams and simple illustrations with this software. The same node which can be used for graphs, can be very easily used for a family tree depiction. Same symbols can be used for simple information depiction, while at the other end, they can stand in as complex entities in ER diagrams. It runs on most operating systems too!
The negatives
yEd by all means, is meant to be a simple information representation tool and its unfair to keep very high expectations from it. It is by no means a ‘drawing software’ like AutoCAD, as it has a completely different style of operation. Many people would find the scope of this software too limited, but it’s important to understand the objective of this software.
Our Verdict:
yEd Graph Editor is a strictly information representative software and is an excellent one at that. If you are looking for a fairly compact and solid software for depicting relationships visually, there is not a better option than this one! It can be used to depict any kind of information flow that you may have in your mind.
