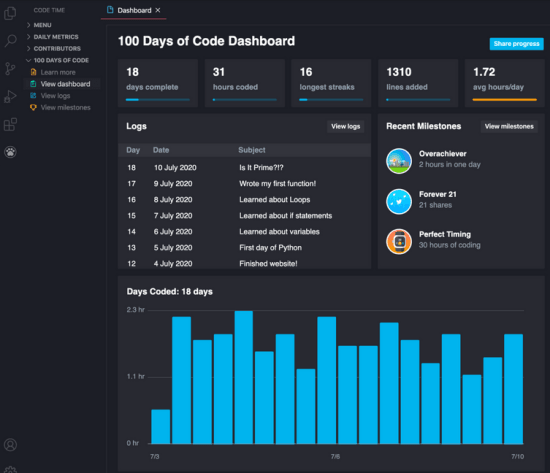
This post talks about a free VS Code plugin that shows you last hundred days of code activity. Basically this plugin monitors your work and then shows you an activity graph with some useful insights that you can analyze. Based on the report that it create for you, you can see the common details such as how many lines of code you have written, average hours spent per day, logs, the longest streaks, and recent milestones. You can see all this information on the beautiful dashboard that it creates and keeps it updated even on the online version.
The 100 Days of Code plugin is provided by Software.com. You just have to create a free account on the website and then you can even see all your coding in stats there as well apart from Visual Studio Code. This is a very simple plugin and you just have to install it and activate it. After that it just works instantaneously, and will keep updating the dashboard with details depending on how much time you spend on coding. Apart from seeing the overall status on the dashboard, you can even see daily stats.

How to See Last 100 Days of Code Statistics with this VS Code Plugin?
Installing and using this VS Code plugin very simple. You just find this extension in marketplace within the VS Code itself or use this link. Just look for it and when it appears, simply install it and wait for the installation process to finish. When it has been installed successfully then you will see the Code Time icon in the sidebar.

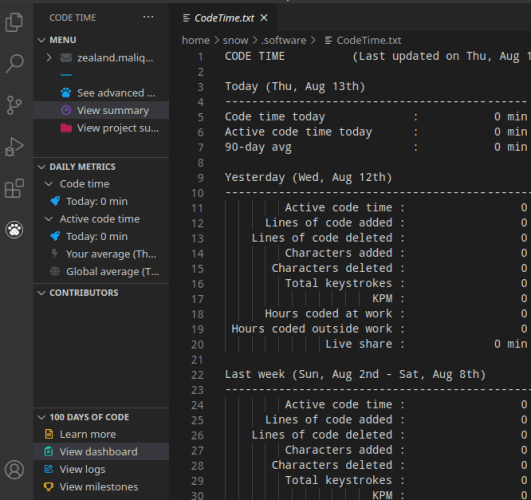
Now, you can just keep it running in the background and it will handle all things on its own. If you are new to it then you will have to create a free account on the Software.com website. After that, log in with that account in the IDE and then all your activities will now be available on the online dashboard as well. The simple interface of the Code Time and daily analytics look like as shown in the screenshot below. This is a text based dashboard.

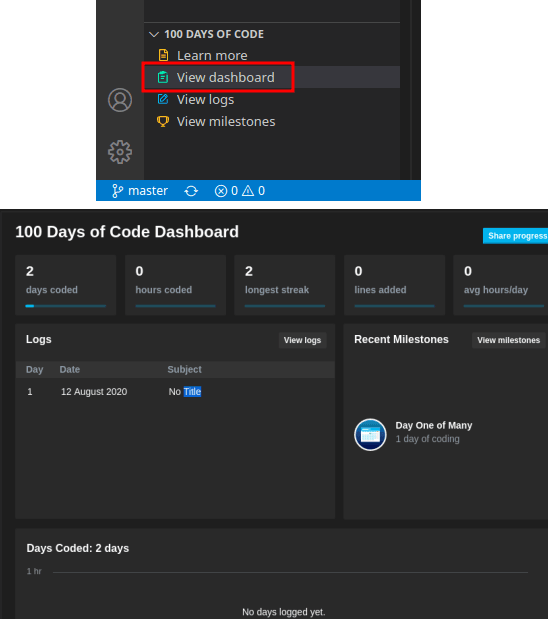
If you want to see your visual dashboard with all the key details then you just have to click on the “View Dashboard” option. This is a simple as that. In the screenshot below, you can see how the visual dashboard looks like. At first, it is kind of empty because I am just install it now but a long as you keep going it will keep updating statistics.

In this way, you can use this simple and really useful plugin for VS. If you would like to keep log of all your coding activities then this plugin is the very good choice for you. It is also helpful in case if you want to showcase your progress to your GitHub profile or Twitter. You will also gain different milestones as well along the way.
Closing thoughts
To be honest, this is one of the best VS Code plugin I have ever used. And I must say that if you’re into coding of any kind then just log your progress and see how well you are doing. And the plugin I have mentioned here lets you do that. You can see your progress in the last hundred days and then you can make certain decisions on how you can improve yourself. This is also good for showcasing your code statistics on various other platforms. So, if you are a VS Code user and looking for a good statistics plugin that can record your progress then just give 100 Days of Code a try.