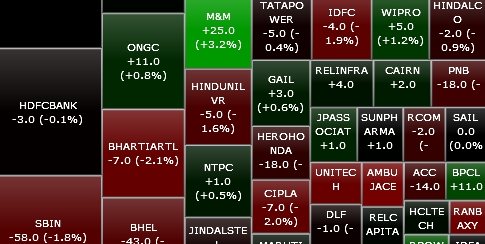
StockViz is a free stock price change tracking application that is especially made for Indian stock markets (BSE and NSE). StockViz tracks stock price changes of stocks, and shows stock price changes in form of heat maps. If stock price goes down, it is displayed in Red color, with intensity of Red representing the percentage by which stock price has gone down. Similarly, if a stock price goes up, StockViz shows that stock in Green color, with intensity of Green proportional to percentage by which stock price has gone up.
StockViz neatly organizes the stocks in form of heat maps, so that you can quickly see which stock has gone down or gone up more. It lets you track indices, as well as search for and track individual stocks.
The stock prices on StockViz are refreshed every 30 seconds, so that you always get latest price changes of stocks.
StockViz is not a stock portfolio tracker like (TakeStock, TickVue, and JStock), but it lets you track stock price changes. This is especially useful for day traders, whose complete business centers around these stock price changes.
Other easy way to track stock price changes is by using desktop stock price ticker.
Download StockViz free here.
