Graph is a very useful software to plot mathematical functions in coordinate system. It is basically a 2 dimensional graph support for maths enthusiasts and engineers. It lets us to deal with three types of Functions; they are Standard function y=f(x), Parametric Functions x(t), y(t), and Polar functions r=f(t). You can also plot graph by providing series of both x and y coordinates. You can add a Tangent or Normal to any selected Function. It also has the option to draw a curve to best fit selected point series. You can also add shading to a selected Function. Graph of any relation equation can also be plotted using this software. You can also add any text to the plotted graph.
Graph plotting is a very important aspect of mathematics and core engineering. And plotting graph on computer is very helpful in saving a lot of time.

Since graph currently plots mathematical functions in 2 dimensional graphs only, so you can check Functy to draw 3 dimensional graphs for mathematical functions.
How to Plot Mathematical Functions In Coordinate System:
Graph is a very interesting tool for mathematical enthusiasts to plot mathematical functions in coordinate system. Graph not only works with Windows but it also works with Mac through Wine.
First you need to download and install this software from the link at the bottom. On running the software, its interface pops out, where first you need to set both X and Y axis. You can also set a default X and Y axis. Once the axes are set, you can start plotting graphs by inserting functions.
There are many useful important tools present in the toolbar of Graph.
These are the important tools of Graph:
- Insert Function: This tool first lets you select from the pre defined function type and then enter the function equation. You also need to enter the range of the used variable. It also lets you customize important Graph properties.

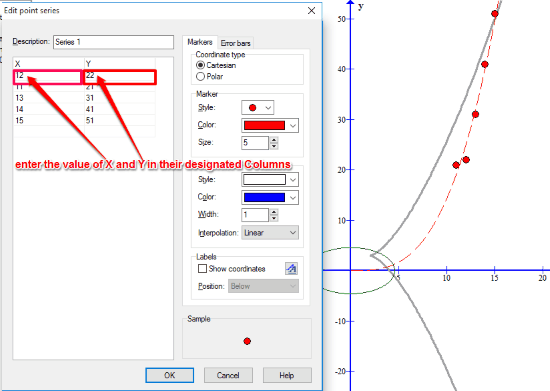
- Insert Point series: With this tool you can insert the respective value of both X and Y to plot their graph. You can also customize the physical properties of the coordinate marker.
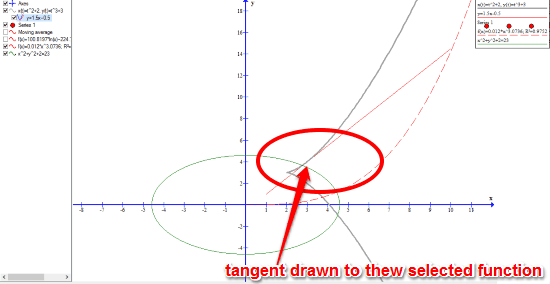
- Insert a Tangent or Normal to the selected Function: If you need to draw a tangent or normal to any function, then you can use this tool to easily do that.
- Insert a curve to best fit the selected point series: This tool helps to draw a curve to best fit the selected point series in the graph.
- Add Shading to the selected function: You can use this tool to Shade the area related to the selected function in 6 different portions. These different portions are, Between function and x-axis, Below function, Above function, Between function and Y-axis, Inside function, and Between function.
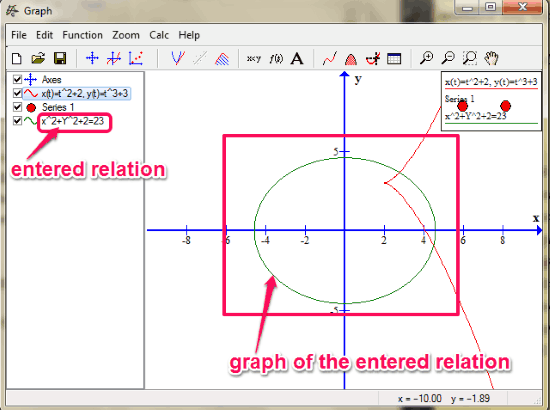
- Insert Relation: This tool enables you to plot graph of Relation equations.
- Create custom Functions and constants to use in graphs: This tool can be used to create some custom function and constants to use in graph plotting.
- Insert text labels: You can insert texts in the plotted graph using this tool. It also allows to customize fonts, font color, font size, etc.
- Calculate the length between two given points on the curve: It calculates the length of path along the curve between two given points.
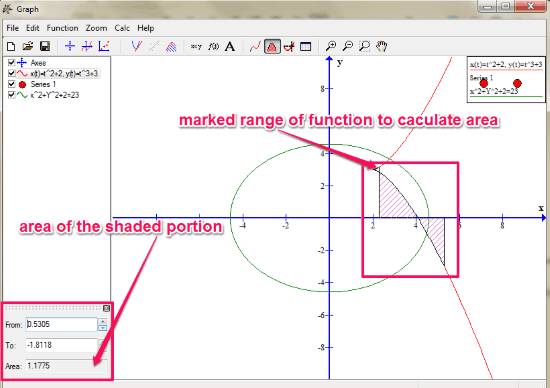
- Calculate definite integral over given interval: It calculates the signed area between the function and the X-axis. You can either enter the start and end coordinate for which you want to calculate the area or you can mark the range of function on the graph using mouse.
- Evaluate or trace the selected function: This tool allows you to evaluate selected function for any value you want to evaluate it for.
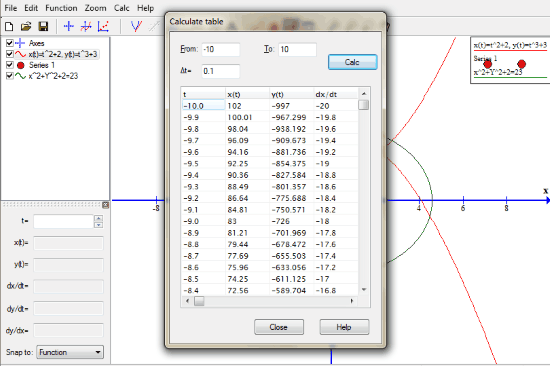
- Show an evaluation table: With this tool, you can prepare an evaluation table for a defined interval. You also need to provide those intervals and difference between adjoining values in the defined interval.
You can always Zoom in and Zoom out on graph by scrolling the mouse.
Verdict:
Graph is a very useful software to plot mathematical functions and even evaluate them. The best thing about Graph is that it provides different colors and lines to represent different function equations, so that it doesn’t get too much complicated. It worked quite well with me and I hope all the mathematical enthusiasts would definitely find it very useful.