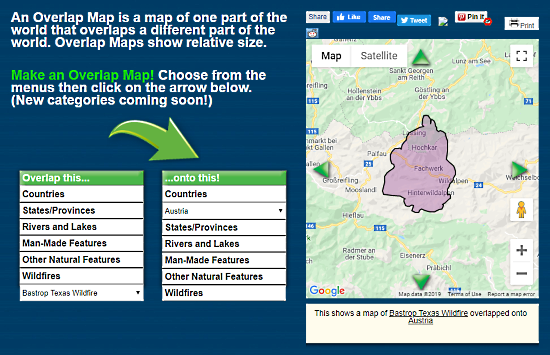
This article covers a free online tool to create visual comparison of places on earth by overlapping maps. The name of this web tool is Overlap Maps. It is basically a geographical tool that lets you place two maps on top of each other to have a visual comparison.
With the help of this tool, you can quickly create visual comparisons of the size of countries, US states/provinces, rivers, lakes, man-made features, wildfires, and other natural features. To create a comparison, you have to choose an overlap map and a base map. Then, it shows you the size selected overlap map on top of the base map to give you a perspective. This way, you can have a visual comparison between any two places.
Also read: Interactive Historical Topographic Maps to View Topographical Changes over Last 130 Years
Create Visual Comparison of Any Place on Earth by Overlapping Maps
Creating a visual comparison of two different places by overlapping maps is very simple. This tool has two catalogs of maps, one to pick the overlap map (left) and another to pick the base map (right). You can pick the respective items from these catalogs and overlap them to create a comparison by tapping the arrow button.

For example, let say you want to know how much area is affected by the Texas wildfire by comparing it to Austria. To do that, select the texas wildfire map as the overlap map and pick Austria in the base map. Doing this will shows an overlay of the Texas wildfire map onto a map with Austria in the center. You can move the map and overlay around to have a better comparison.
Wrap Up
Overlap map is a handy tool to easily compare any two places on the Earth. It can be really useful for teachers to give their students a visual perspective of two places by comparing their relative size. Give it a try yourself and share your thoughts with us in the comments.