This article explains a simple method to get HubSpot reports in Google Sheets for free. Demand Sage for HubSpot is a free GSuite add-on that lets you do that. You can configure this add-on by connecting it with your Google and HubSpot account. This way, you can have a collaborative workbench within Google Sheets where you can access and HubSpot data and generate reports.
Demand Sage offers 1-click reporting templates that you can set up once and then it automatically syncs data from HubSpot. It also offers a custom report builder that offers flexibility as per your needs. Furthermore, with reports, you can easily find insights into your HubSpot data and identify pipeline bottlenecks. You can take the advance of spreadsheets to create data views that are not quite possible in HubSpot.
Also read: Free HubSpot Landing Page Builder with SEO Optimization, Performance Tracking
Get HubSpot Reports in Google Sheets
To get started with Demand Sage simply install its Sheets add-on from the GSuite Marketplace. Here is a direct link to that. Once the add-on is installed, it appears under the Add-ons tab on the menubar of Google Sheets. Access this extension from there and click the “Start” option.

Since this would be an initial run of the add-on so you have to connect it with your account. It prompts a popup for the same. You can just follow the steps in the popup to connect Demand Sage to your Google and HubSpot account and grant access to your data.
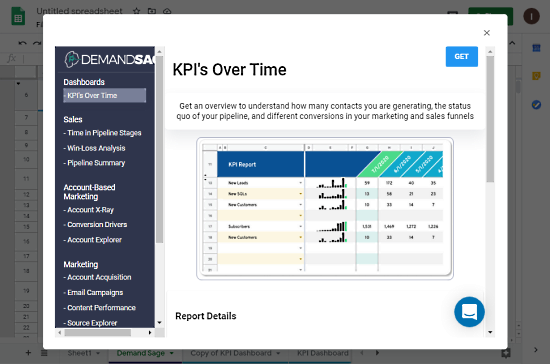
After connecting your accounts and permitting the permissions, when you access the add-on again, it shows you a list of features that it can do. Along with that, there is a button to get data from HubSpot and create a Demand Sage dashboard in the sheets.
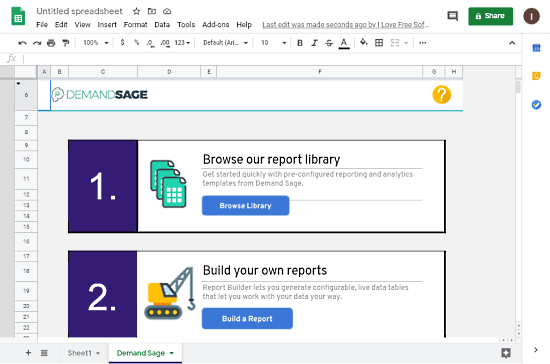
Doing this adds a new sheet called “DemandSage”. In this sheet, you get an option to browse your report library and build custom reports. From here, you can browse the library to find a pre-configured reporting template. Then, you can pick your data types to generate a report in the Sheets.
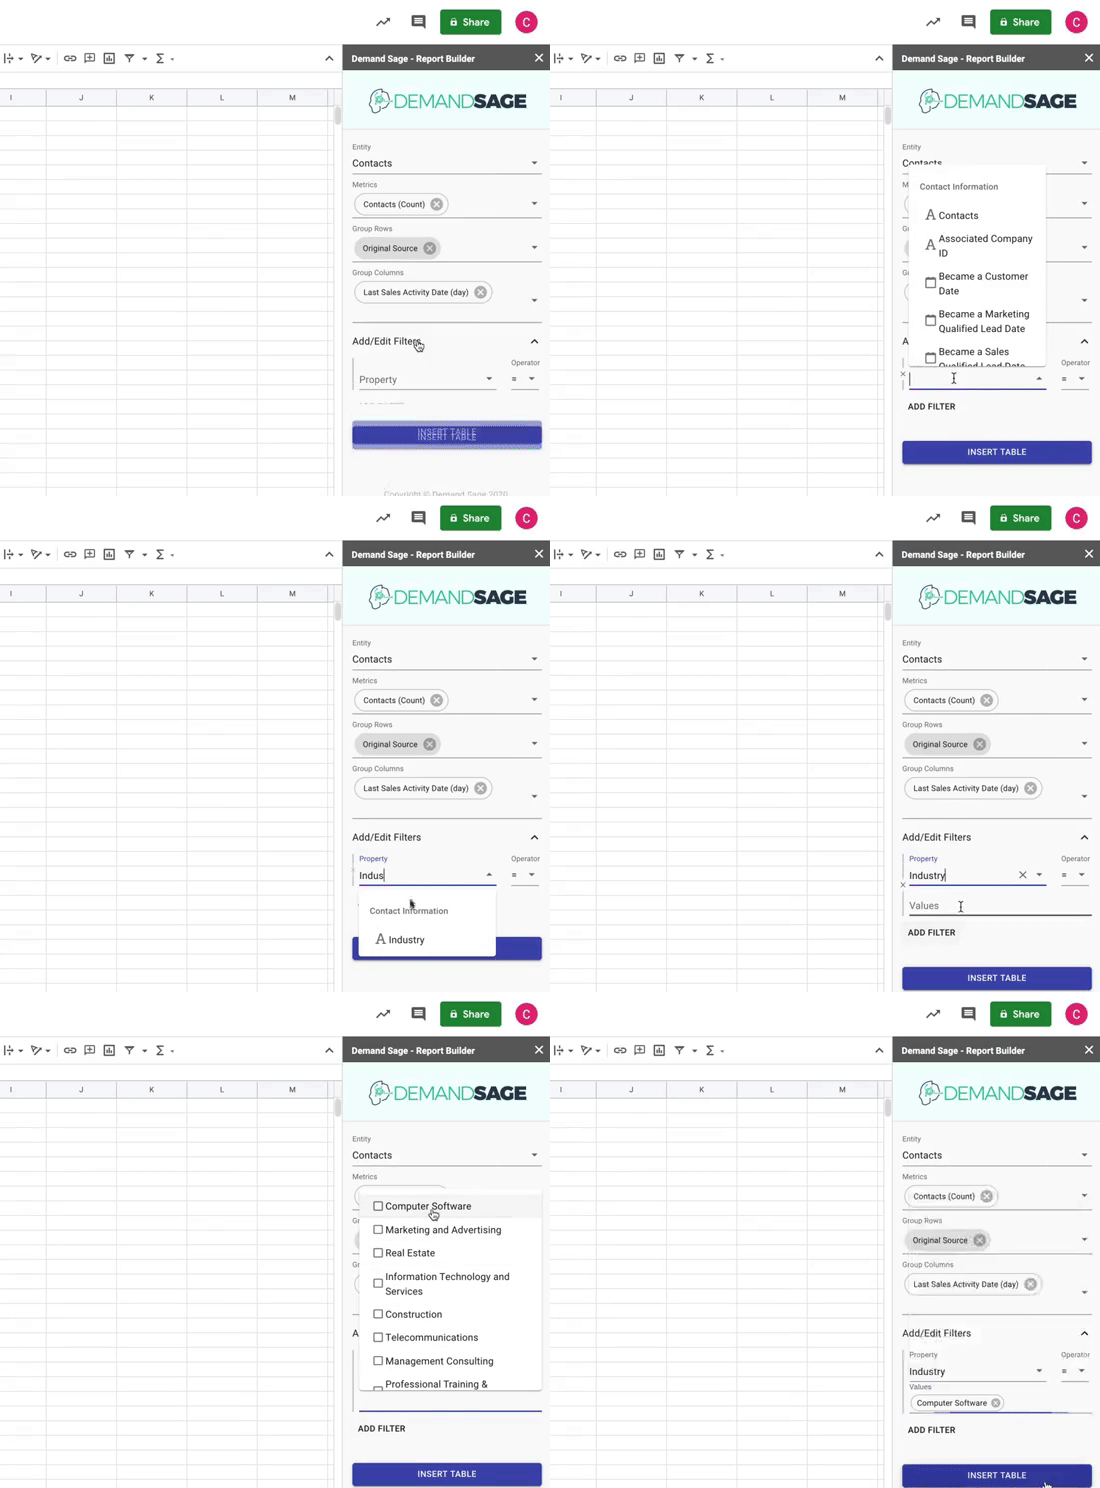
With the second option, you get options to generate configurable data tables. This opens a popup on the side where you can ingest record-level HubSpot data to find insights. You can also define filters for data types and create automatic properties.
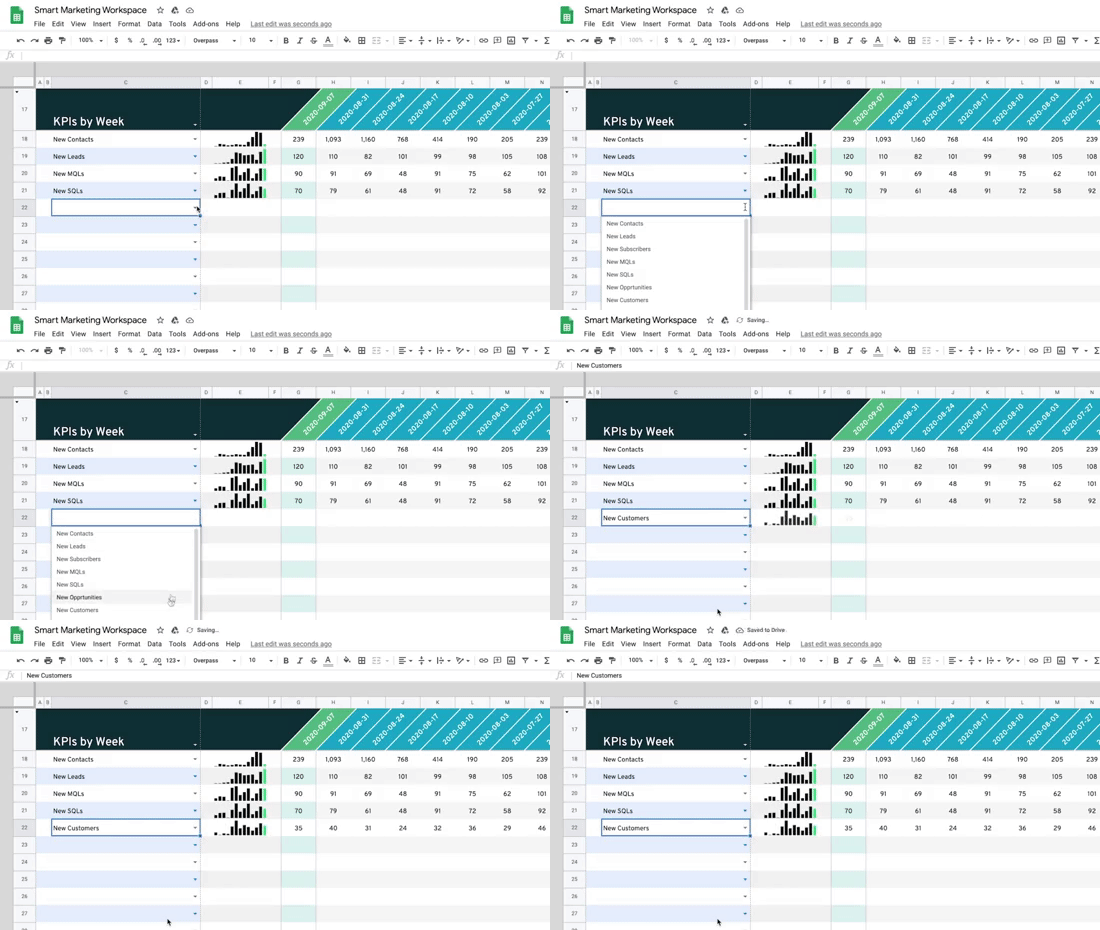
Each report is added as a new sheet to the main Google Sheets document. The report offers attributes for funnels that you can pick to build custom reports and visualize different types of related data together. This can also help you spot bottlenecks and overflows within the pipelines.
Closing Words
DemandSage is a really handy tool that makes it easy to read and visualize HubSpot reports. Instead of having linear data, you can create tables and build custom reports. This lets you examine your pipelines in detail and you get insight into what matters the most. Give it a try yourself and share your thoughts with us in the comments.