Solving equations and plotting the graphs in Google Docs manually is quite a difficult thing, right? But not anymore, as there is a fantastic add-on for Google Docs, named as Wizkids CAS. It helps you to automatically solve a complex equation and gives you the solution. Moreover, it also provides the facility to plot the graph for equation inserted by you.
This add-on works with the built-in Equation option (under Insert menu) available in Google Docs. Once you have added the equation, you can open the sidebar of this add-on to insert values of variables and get the solution.
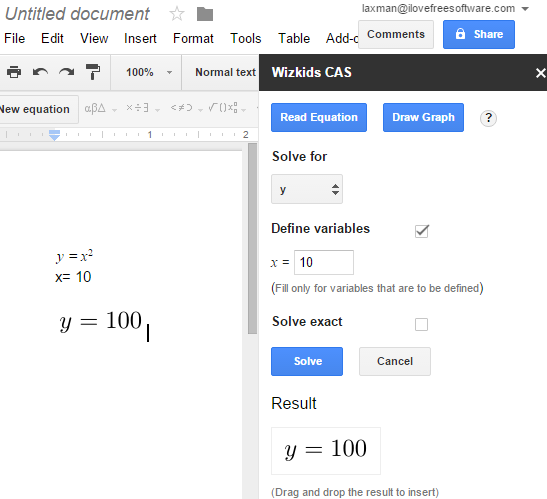
You can also drag and drop the solution to a particular line in your document.
Above you can see a simple equation solved by me with the help of this add-on.
Check out these other fantastic Google Docs add-ons: write music in Google Docs, publish documents to WordPress, and add audio comments in a document.
How To Solve Equations and Plot Graphs in Google Docs?
Install this Wizkids CAS add-on with the help of this link. After this, it will open a new document, and ask permission to run. Grant the permission and it will be added.
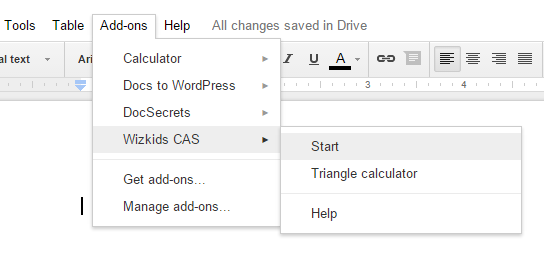
Now use Insert menu to access the Equation option and insert an equation in your document. Keep the mouse cursor in the equation, otherwise you won’t be able to use this add-on to solve equation and/or plot the graph. After this, go to Add-ons menu → Wizkids CAS → Start.
Note: You will also find Triangle Calculator option just below the Start option, but it requires some license to use. Perhaps, you need to upgrade with paid subscription to use this feature.
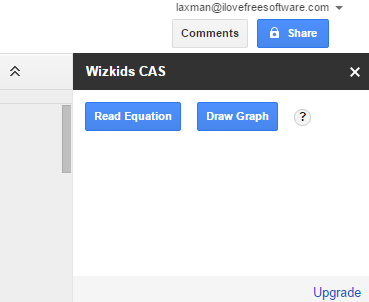
After clicking on Start option, right sidebar of this add-on will open. It has two buttons: Read Equation and Draw Graph.
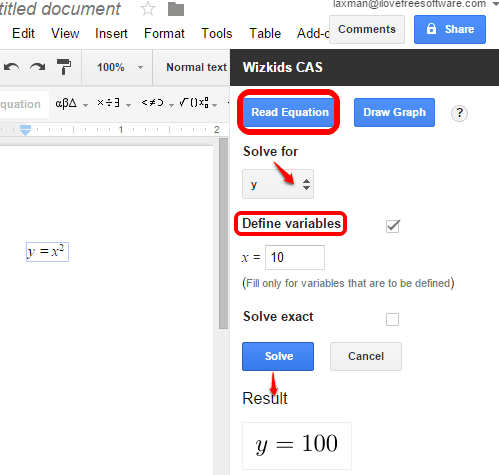
Using Read Equation button, you will be able to select the variable (say x or y) for which you want the equation. Moreover, you can also define the value of the variable. Finally, you can click on Solve button, and it will generate the result shortly.
When the result is in front of you, you can drag n drop it in the document.
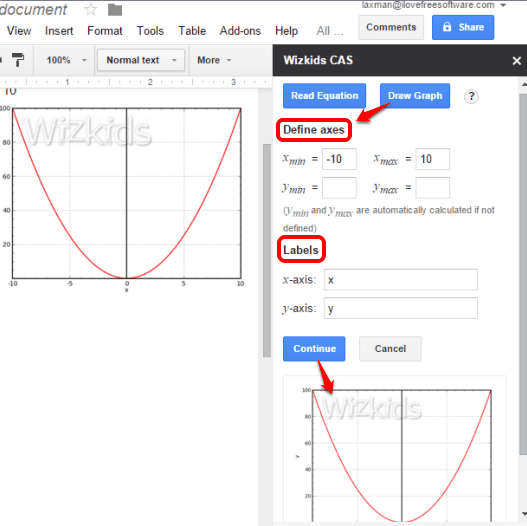
Using Draw Graph button, you can generate the graph for the equation added by you. You need to define the axes and the labels. After this, click on Continue button, and it will generate the graph.
Now you can drag n drop the graph to add in the document. The graph will contain the watermark of this add-on, but it’s not a thing to worry when you are plotting the graph for personal use.
Conclusion:
Wizkids CAS is an interesting and very helpful add-on for Google Docs to automatically solve the equations as well as plot the graphs. All it wants from you is to define the variables and insert the values. The rest of the task to solve equation and plot graph is done automatically by this add-on.
