This article covers a free tool to simplify Google Analytics into read-only mode. No doubt Google Analytics offers great insights into website traffic but at the same time, it’s complicated to use. The interface of Google Analytics is quite confusing and has a steep learning curve.
FlatGA is a free website that simplifies Google Analytics into a neat user-friendly layout. This website shows all the important information at once place without any complicated menus or sheets. It covers total page views, unique users, bounce rate, top pages, and referrals along with traffic breakdown by countries, devices, operating systems, and browsers. All you have to do is log in with your Google Analytics account and it lists all the domains registered with that account. You can fetch the reports for 1 day to past 90 days and export the results to CSV. This website doesn’t store any of your data except the access token to get the Google Analytics stats.
Also read: How to Add Google Analytics to Google Docs to Track Users Visit
Simplify Google Analytics into Read-Only Mode with FlatGA
If you want a quick look into your traffic or a newbie into the traffic analysis, FlatGA is a nice website to start with. You can connect the website with your Google Analytics account and access the traffic reports from all the domains connected to your account. From the top, you can pick a domain and a time cycle to get a report.

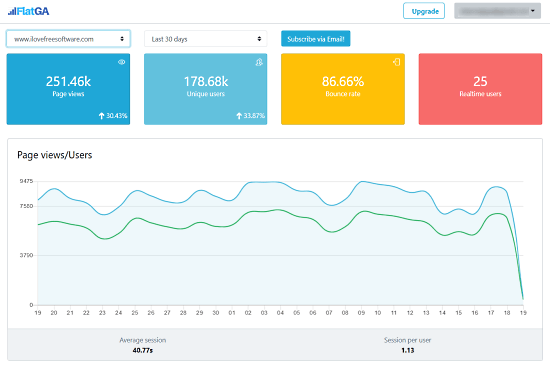
As you choose a domain and time period, this website instantly refreshes the stats shows to you on a neat and colorful interface. On the top, it shows you a quick overview of the website traffic by covering the followings:
- Page Views (with gain percentage)
- Unique Users (with gain percentage)
- Bounce rate
- Realtime Users
These stats are followed by a Page views/Users graph. The graph shows the trend of page views and users over the selected period of time and tells you the average session time and session per user.
Top Pages & Referrals

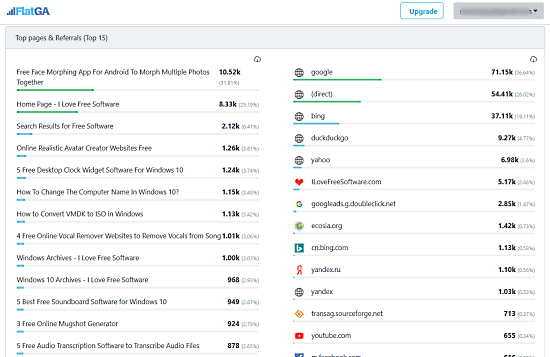
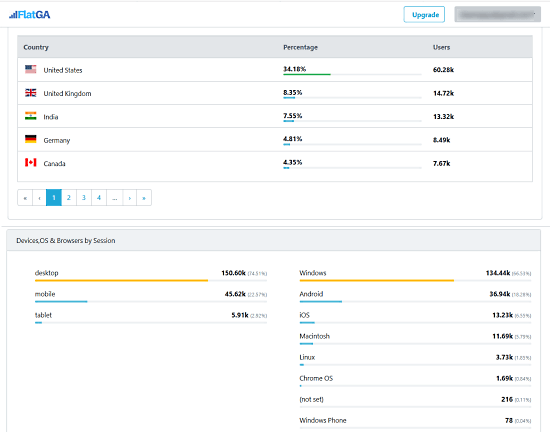
This website lists the top pages of your website along with a traffic breakdown by referring platforms. The list shows you the stats for each page and uses color-code to highlight the referrals. From here, you can export both, top pages list and referral list to CSV. Next to these lists, you get a ‘Country’ section where you can check the number of users and traffic you are getting from various countries.
Sessions Breakdown

Last but not least, it breaks down the website sessions by devices, OS, and platforms. This section shows you the percentage of sessions you are getting from desktop, mobile, and tablet. It also shows the sessions by OS covering Windows, Android, iOS, Macintosh, Linux, Chrome OS, Windows Phone, BlackBerry, and others. And in last, it covers the session breakdown by browsers covering what percentage of sessions are from which browsers. Since all the stats are color-coded, you can track the sessions and traffic back to OS, device, country, and referrals.
Wrap Up
FlatGA simplifies Google Analytics into a read-only mode without any complicated menus or sheets. This allows you to easily check the overall stats to see the traffic on your websites. As the main highlight of this website is simplicity it does not have any feature to check individual page or anything. Still, It’s a better alternative that you can use instead of giving read-only access to someone who has no knowledge of Google Analytics. Try it yourself and let us know your thoughts in the comments.