This article explains how to do sensitivity analysis in Google Sheets to simulate scenarios. Casual.app is a web application to simulate hundreds of scenarios for sensitivity analysis. This allows users to test their models for possible outcomes and be aware of all the uncertainties. Now, there is an add-on that brings the same to Google Sheets.
Casual – Scenario is an official add-on by Casual.app\ that brings the sensitivity analysis to Google Sheets. Generally, all the models are stored in spreadsheets and usual spreadsheet programs do not offer any sort of analysis. To do that, you have to migrate the data to a dedicated software or app. But, with this add-on installed, you can simulate scenarios on your data within the spreadsheet. So, let’s check out how to do that.

Also read: How to Store Email Replies in Google Sheets
Sensitivity Analysis in Google Sheets to Simulate Scenarios
To begin with sensitivity analysis in Google Sheets, you have to install the add-on. The add-on is available in the GSuite Marketplace for free, here is a link to the same. After installing the plugin, you can use it in any of your spreadsheets to simulate scenarios.
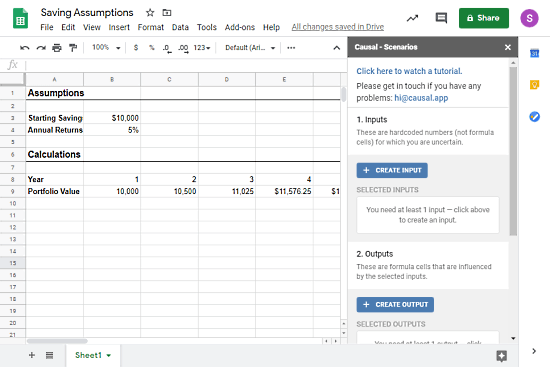
Let me explain the working of this add-on through an example. I have this data in a spreadsheet with my assumptions. Let’s say I have a ‘Starting Saving‘ amount with a possibility to get a 5% ‘Annual Returns‘ on it. For this, I can easily calculate the ‘Portfolio Value‘ over the years. The ‘Annual Returns‘ is an assumption with a varying range, it has uncertainty. Now, I like to analyze the sensitivity of the ‘Annual Returns‘ over time.

To analyze the sensitivity of Annual Returns, I have to simulate the varying return rates over time which can be easily done with this add-on. The add-on has options for inputs and outputs. Assumptions are the input and the possible outcomes that are affected by the assumptions is the output. So, in this case, Annual Returns is the input, and Portfolio Values are output.

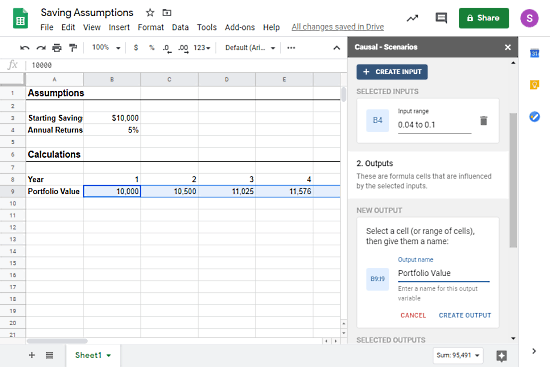
I create a new input in the add-on. To do that, we have to have to click the “Create Input” button. This gives an option to select the input cell on the sheet and enter a range for it. So, I pick the ‘B4’ cell and set the range to say 0.04 to 0.1. Similarly, I set the ‘Portfolio Value’ as output. In the case of output, you have to pick a range of cells with the formula. As you can see, I pick the ‘B4’ ‘B9’ ‘Portfolio Value‘ as the output range.

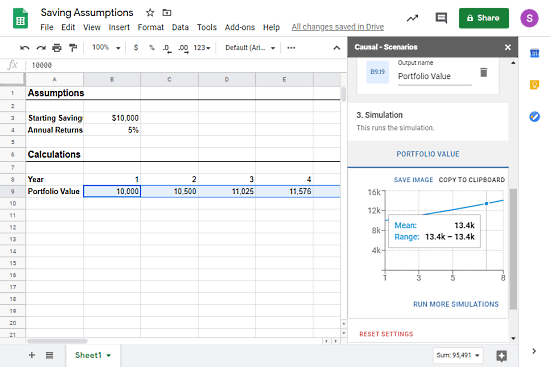
Now, when I run the simulation, this add-on calculates the ‘Portfolio Value‘ for the varying ‘Annual Returns‘. You can see this happening on the sheet. Once the simulation ends, it gives us a graph for ‘Portfolio Value‘ with an estimated range and means. From there, you can save the graph as an image and copy it to the clipboard. One simulation is never enough and this add-on as many simulations as you want on the same data just by a click of a button. This way, you can gather data from multiple simulations for sensitivity analysis and lower the risk factors and uncertainties.
Closing Words
Casual – Scenario is a powerful add-on that brings the sensitivity analysis within Google Sheets. It can easily run hundreds of simulations on your data without leaving the spreadsheets. Even if you are already using a robust sensitivity analysis tool, this add-on would come handy for small or momentarily simulations without copy-pasting data back and forth. And if you want more then the Casual.app is worth checking.