Loggr is a free iPad app to track anything and get statistics in form of graphs. This app lets you keep track of anything which you can think of. For each of the thing which you are tracking, app displays relevant statistics with colorful graphs, so that you can analyze them better.
The app comes with a default list of activities that you can track. It also gives you an option to add your own activities to track them.
To track any activity, just enter the quantity that you have achieved for that activity. Let’s say you want to track how many push ups you do each day. In that case, whenever you do push ups, you just need to enter the number of push ups done. Then, at anytime, you can track how many pushups you have been doing over time (in form of a nice graph). It will also show other statistics, like Maximum, Minimum, Mean, Mode, Median, Standard Deviation, Highest/Lowest Ranking, Distribution, Correlation.
You can even link your Moves and RunKeeper account with the app. All the stats and data can also be exported in CSV format and can also be synced with Dropbox.
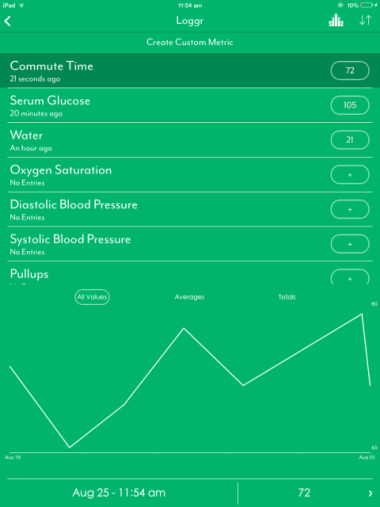
Owing to the fact that you can add any activity to the app, you can use it to track essentially anything you want. The default activities that are available in the app include Commute Time, Water intake, Oxygen Saturation, Pushups, Pullups, Situps, Squats, Running Distance, Walking Distance, Sleep Duration, Respiration, Body Weight, Heart Rate, and many more such activities.
How to Track Anything on iPad with Loggr App:
When you launch Loggr iPad app, you will be directly taken to home screen of the app. You don’t have to register with app to use it.
On the home screen of the app, you will find the default 6 groups of metrics: All Logs, Diet, Fitness, Health, Life, and Medical. These groups contain different activities which you can track, while All Logs option contains all the activities irrespective of their group.
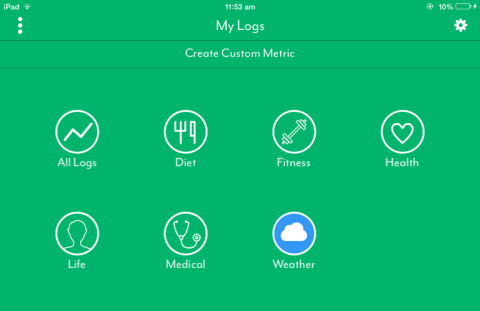
To track any of the activity, tap on the group in which it resides. For this review, I will select an activity from All Logs group. For that, I clicked on “All Logs” option. This brings up the interface as shown below:
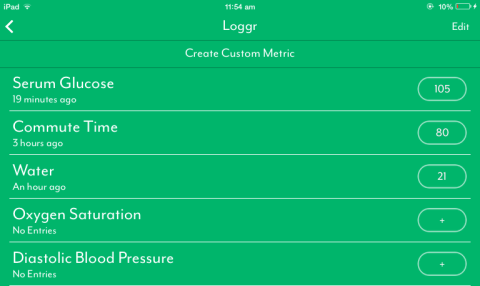
It will list all the activities under “All Activities”. Additionally, it has an option to “Create Custom Metric”. This option lets you add any activity to app manually. You only have to give it a name and select a group (optional) for it.
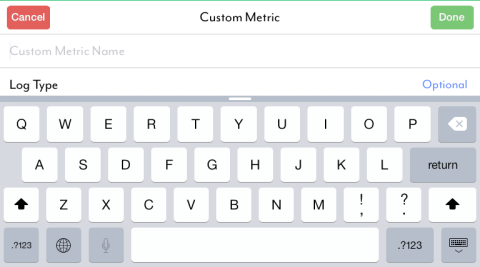
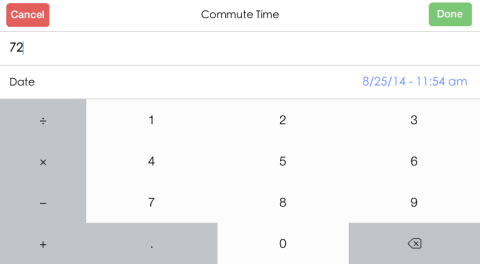
Now, you can see that each of the activity with No entry has a + icon in front of them. Tap on it to enter your first entry about the activity. For entering entry, you have to enter value and date on which you performed activity. You can also perform some basic mathematical operations with numbers, before entering the exact value. Tap on Done to save the entry.
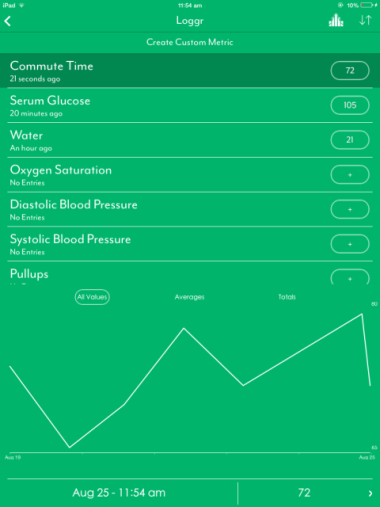
After saving the entry, you will see that the plus icon has been replaced by data entered by you. Similarly, you can add as many entries you want by tapping on this option. For checking stats, you have to tap on name of activity. You will see a graph with latest entry being displayed at bottom. You can get graph for All Values, Averages, and Totals.
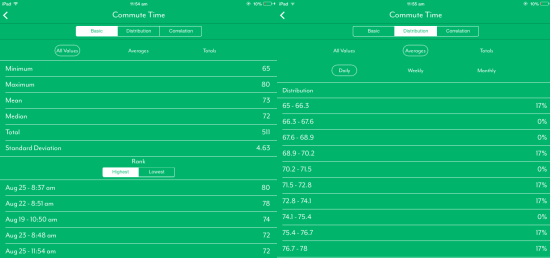
If you want to see advanced statistics, then you have to tap on Graph icon at top right corner. In advanced statistics, you can check different stats like Maximum, Minimum, Mean, Mode, Median, Standard Deviation, Highest/Lowest Ranking, Distribution, Correlation, etc.. These stats helps you in having a better and deeper insight into your activities performing ability.
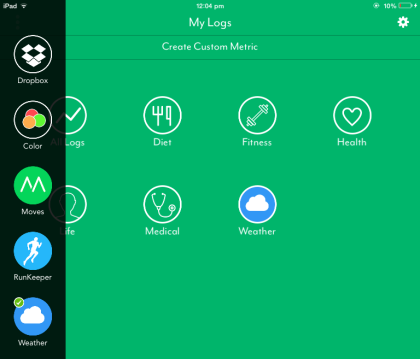
The option for linking app to your Dropbox, Moves, or Runkeeper can be found by tapping three bar icon at app’s home screen.
You may also like: Track Time Spent on Different Activities on PC with RescueTime.
Final Verdict:
Loggr is a really cool free iPad app to track anything, check statistics, and graphs. The best thing I liked about the app is that you have complete freedom for adding and tracking any activity. This app doesn’t limit you to certain activities. The feature to share your data is also good. Do give it a try.