SourceMonitor is a free source code analysis software to quickly analyze your source code. It lets you view the number of lines of codes, number of statements, number of functions and the complexity of those functions used in the source code. It supports source code for C, HTML, C#, C++, Java, VB.NET, Delphi and Visual Basic. It automatically decides the include files according to the programming language chosen. It lets you create checkpoints at different levels of development of the program. It also allows parsing of UTF-8 format while importing the code. SourceMonitor draws graphs that lets you easily compare checkpoints created and gauge the progress of the development of the program.
Lets discuss some of the features of this free source code analysis software.
This freeware has an easy interface that looks no different from your IDE that you use. It’s easy and step wise approach lets you import your source code easily into the software without much complication (complications set aside for the coding part).
Importing the Source Code
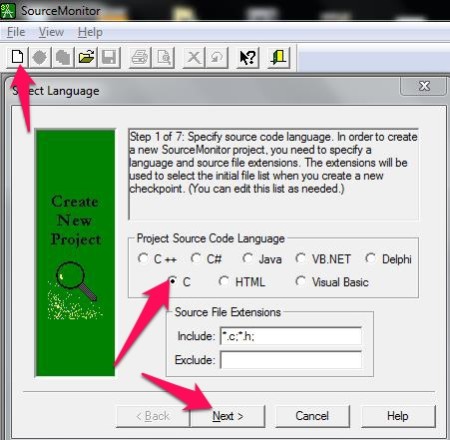
I will import a C source file for test as I am familiar with that. The source code for the file I am importing here is a simple program to calculate the square, cube and multiply a number five times by itself (ex: 55). Nothing much to show off but enough to understand how this software works.
It gives you an option to search for an entire directory for source files. This is where you have to mention the folder where you’re project resides.
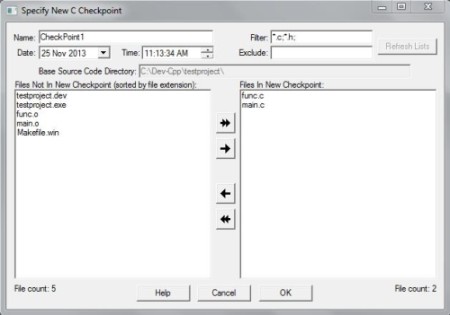
You can ignore the Header and Footer comments and tell the software not to count the number of blank lines (I love to put blank lines; improves the readability of the code). Once we’re done with this, we can give a name to the checkpoint, something like, Checkpoint1 or TheFirstCheckpoint. The software automatically includes all the source files however you can include other files if the software missed out something.
What are Checkpoints
Checkpoints, as the name suggests, are bookmarks created in SourceMonitor to gauge the progress of the development of your program. Before, making any major changes to your program, you can create a checkpoint and once the amendments are complete, you can create another checkpoint and compare them or keep them for future reference.
I created a checkpoint named “Checkpoint1” and later added another function to “func.c”. Now, I created another checkpoint named “Checkpoint2”. In the similar way, I can create as many checkpoint as I want and keep a check on my program at different stages of development.
You can see from the image below. It shows you a preview of the number of source files, number of lines, statements and even comments too.
Metrics Details
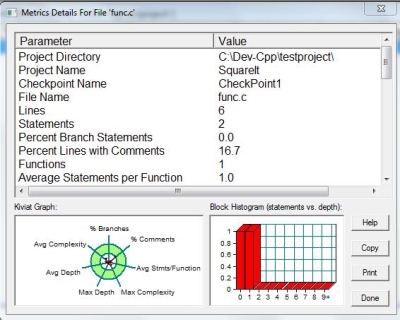
You can pull up this screen by just double clicking on the name of the source code file (within the software, once checkpoints are created) for which you want to view the details for. It gives you the number of lines of code, statements, number of functions, average number of statements per line for a function and tells you the most complicated function in the source code. This free source code analyzer also decides which is the most complicated function in the source code according to the metrics details of the source code. This would give you a hint of where things could go wrong if you have a bug in your program that you’re trying to track down.
SourceMonitor shows you a pie chart showing you the average complexity, statements and functions and the percentage of comments. The Bar Graph shows you the statements vs. depth. As you know, comments are one of the most important aspects of programming when it comes to the readability of your source code. You, as a Project Manager, can set standards for the percentage of comments, number of statements and function etc., in a source code, and quickly analyze the code once they’re submitted to you by just looking at the chart. You can copy this data on to any text editor and forward it further for analyses. This also lets you print out the data if you wish to.
What if you want to view a consolidated metrics details for a checkpoint? That’s simple, click on the checkpoint to select it. Now, click on “View” from the Menubar and click on “Display Checkpoint Metrics Summary…” to view the Metrics Summary. To view all the functions used in the program (here I mean the whole project that includes all the source code files included in the Checkpoint), click on “View” and “Display Method Metrics..”. To view a chart explaining you the comment percentage, complexity, statements/functions etc.. You can copy the chart to the clipboard if you wish to include this data in another file or save it as Bitmap image. It lets you change the color for the chart too.
How to export the Checkpoint?
Well, if you’re working on a project and you’re not doing the “One man army thing” then you would need to share the data. Copying the whole lot and pasting it is not an option because of the time restrictions you’ve got. Exporting seems to be a good option here. You can export the checkpoint’s summary or details, into a .xml file or a .csv file. This would let you easily import it into another spreadsheet or another customized tool. To export, select the checkpoint by clicking on it and click on “Checkpoint” from the MenuBar and choose “Export Checkpoint Summary(s) as XML”, “Export Checkpoint Detail(s) as XML”, or “Export Checkpoint Details as CSV…” appropriately.
Some features that might attract you
We will review some important features in this software that might help you while you’re comparing this software with a similar software.
- It’s a free source code analyzer and fast at what is does.
- Creates the graphs and charts to make the analyses better.
- You can export checkpoint information to .XML or .CSV. This makes it easy for you to import it into another software.
- Lets you copy the chart into clipboard.
- It automatically analyses the code to decide for the complexity of the source code and the most complex function. This lets you easily track the function or code fragments where the bugs are hiding.
- Supports HTML, C#, C, C++, Java, VB.NET, Delphi and Visual Basic. So, you’re not limited to one language as it supports the most of the popular languages.
- It can parse UTF-8 while importing the code.
Conclusion
SourceMonitor is a good option if you’re looking for a free source code analyzer that supports variety of languages. It makes it easier for you to analyze the source code, instead of doing it manually. The complexity calculator lets you track bugs easily and that’s one of the most common issues that programmer face while working on a project. You can set standard for coding, for your source code or for others and check if its complying with the standards.
SourceMonitor can come handy when you’re working on projects with a team or individually. You might want to use this tool when you want to view the metrics of the source code and decide your progress or share the report with other developers.


