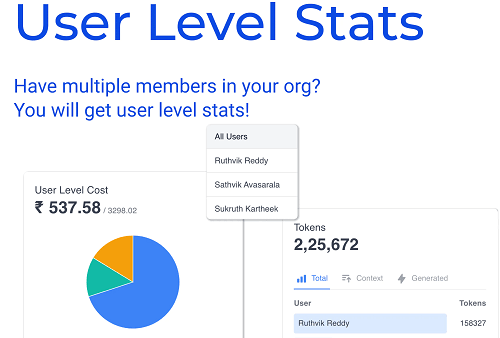
This is a quick tutorial to show how to see Open AI analytics for API usage. Puddl is a free online tool to do that. Here it can display various insights about your Open AI account and usage like professional analytics tool such as Google Analytics.
There is a simple usage section in the Open AI Playground to track the cost usage. But it doesn’t really give a good video. Puddl aims to solve that. It uses the Open AI Cost API to connect to your account and then display the usage statistics with graphs beautifully.
Here Puddle can show you the following statistics about the Open AI API:
- Total Usage.
- Total Cost.
- Usage by Date Range.
- Average Daily Traffic.
- Number of Tokens.
- Number of Requests.
You can see all the above-mentioned details on the main page of Puddl. For now, there is no option to export the analytics, but I hope they add something for that in the later updates.

How to see Open AI Analytics for API Usage?
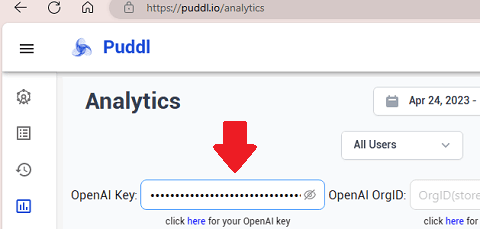
In order to get started, you need to sign up for a free Puddle account and then get started. Once you are on the dashboard, you only need to enter the API key that you can copy from your Open AI account.

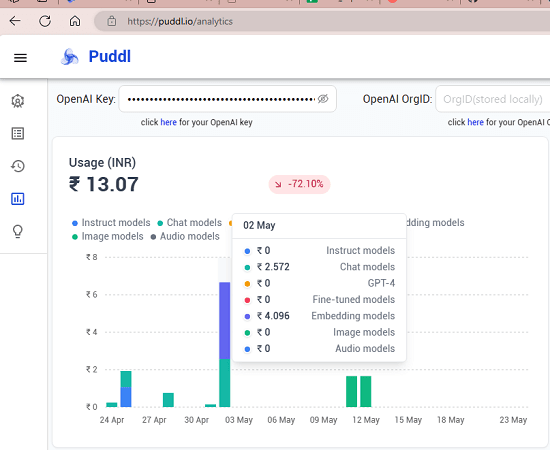
Now, once you enter the API, it will validate it and if the key is valid, you will start seeing the analytics. The main dashboard will kind of look like as shown below with all the important metrics and graphs.

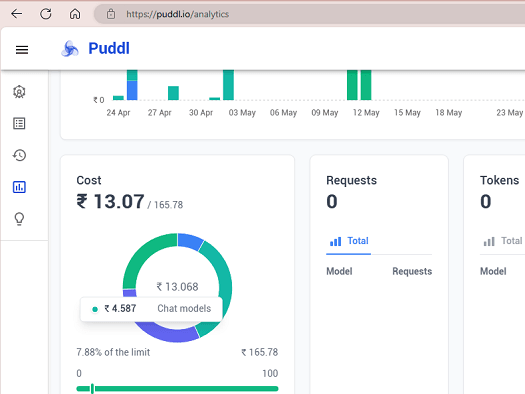
Scroll down further and then you will see detailed usage about the API such as total cost, number of requests, tokens, and more. You can see all the data graphically here as well.

For now, this is the only main dashboard where you can see all the usage of the API in details. There are some things that the maker of this analytics tool will add in the coming updates. But if you need a quick analytics page for your Open AI usage then here you will find it.
Closing thoughts:
If you need a pretty analytics dashboard to track usage of your Open AI API, then Puddl is one of the best free options available for that. You just need to a create a free account and then explore the GPT API usage in more details. You can apply the date filters and analyze the different graphs and then report that it crates. It is a good tool for individuals as well small businesses.