BitMeter OS is open source bandwidth monitor. This free bandwidth monitor tells you how much bandwidth you are using on your internet connection, or network.
This free bandwidth meter gives you details about the connectivity and internet usage in various ways. It is compatible with Windows, Linux and Mac OSX. It monitors the bandwidth you are using with your connection and keeps you updated about the same. View these details in various graphical forms having complete info about the same.
You can use this application in two ways, namely, as web interface and as command line tool. Once you have installed this open source bandwidth monitor in your PC, select option to view your connection usage among the options and continue. However web interface is very simple and effective. It presents you all info about the connection in graphical and chart forms which is easy to understand and readable.
Some other bandwidth monitors that we reviewed earlier include: Networx, Network Activity Monitor, and Network Lights.
Web Based Bandwidth Monitor:
The web interface of BitMeter OS open source application is user friendly and easy to grasp. The charts and graphs are represented with different colors and definitely not loaded with unnecessary information. The presentation is so effective that even a person with little knowledge of connection details will be able to make out the significance of the info provided by this application.
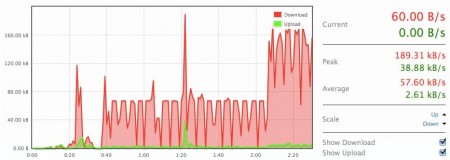
The main window of the interface shows you downloading and uploading speed of your internet connection. The frequency graph is used for the information. You will notice red color waves represents downloading speed while green is for uploading speed. On the right of the window you get info about the connection like current speed in kb/s, peak and average calculation of the data transfer rate. Also view connection speed only for download or upload by checking the box on the right for more detailed understanding.
The BitMeter OS is designed to give you history information about your connection in hours, minutes and days. The details are shown in bar graphs by representing period on the x-axis and data downloaded and uploaded in MB on y-axis. This feature would enable you to keep track of the connection in past. As you move your mouse cursor through graph elements it will show you numerical info for each bar in the graph. You can also export this data in CSV format for your records.
Web interface of BitMeter OS also presents you data in summary form and you can also fill query form to get exact information for particular date, if at all you don’t have time to go through graphs. The query tab will give answers your query for data speed on particular date or period and you get information about download and upload speed in MB/GB. If you find that you are using lot of bandwidth, you can use free software to control bandwidth usage of applications.
