Odo is a fun application which can be used to measure the distance you travel with the mouse pointer on your screen. It is an odometer which collects the data and presents to you the distance you travel over your computer screen on a regular basis. It has the keystroke counter with a link to the database which would also help you in looking up at the history of activities which have been carried out on the screen of your system.
The data is displayed in a graph where the measured values are counted as one minute per horizontal pixel and come in different combination of colors. The colors displayed on the screen have the following interpretation, knowing which you would have no troubles figuring out which color stands for which activity. On the upper graph you have the green and the red colors which stand for horizontal and vertical mouse movements respectively. When you check out the lower graph you have the green red and blue colors where each stand for the Keystrokes, Mouse clicks and the application switches respectively.
The reason of these colors being basic colors the overlapping of the colors while preparing the graphs may result in creating new colors for example: the overlapping of red and green may display a yellow color on the screen, similarly blue and green mix would create a light blue shade on the graphs. If you are looking for some more cursor related software, you can try Auto Hide Mouse Cursor, NeatMouse and IconArt Cursor Creator.
Installing Odo
Follow the following steps and you are done installing Odo on your computer:
- Download the software from here.
- Unzip the downloaded file on your computer
- Open the unzipped folder and you would need to click on the ODO.EXE file to start the program. You need to do no more as it starts the application on your computer.
Every time you wish to access the application or open it you just need to click on the file.
Using Odo to measure distance travelled on screen
After the software is launched you need to give it sometime to record all your activities. Meanwhile you could carry out all the other tasks which you may have on your system. After a while you can minimize all your windows and check out the colorful graph that gets created based on your activities on your system. The graph starts appearing from the right side of your screen and tends to increase with every activity that you perform with your mouse cursor on the screen. With time you would observe the graph to increase in size and give the graphical impact of all your activities. Moreover the initial screen which you may see would appear to be much smaller but you may resize it by moving the mouse at the right bottom end of the entire graph where you will get the option to stretch it and make it look bigger.
Setting Odo
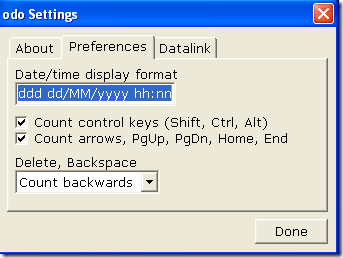
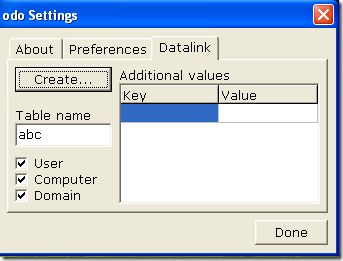
In order to change the settings you need to right click anywhere on the graph and select settings. After clicking on it you would see a popup with three tabs on it. The About tab tells you about the software and its version. Moving to the preferences tab you can change the date and time format, along with checking and un-checking a few options which you would like to be included in the activity for preparing the graph. The Datalink tab allows you to create tables with the options to select the User, Computer and Domain.
Now that you know all about Odo, you can measure the distance you travel with the mouse cursor.


