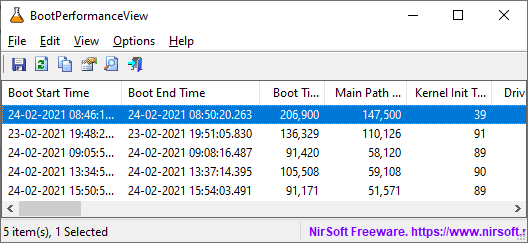
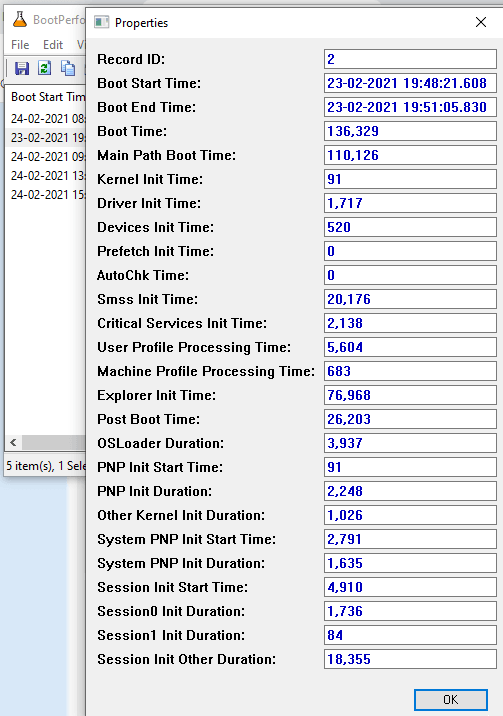
BootPerformanceView is a free software to see boot, kernel, drivers, devices start and ending times in Windows 10. Basically this software keeps log of all the boot operations and shows you a very comprehensive report that you can export. You can use this software to log your boot times and then make a data sheet to compare them later. Also you can use it to audit your system booting process and see where things are lagging. It is a free simple portable software that you can even run from a flash drive to list all the boot sequence parameters with all the details.
Nirsoft has always released some really useful system utilities. Now with BootPerformanceView, sysadmins and IT admins can audit PC’s and Windows servers for boot and kernel initialization related issues. This software can precisely show when a specific boot process started and when it ended. Apart from boot, drivers and kernel initialization times it can even show you user profile processing time, prefetch init time, machine profile processing time, explorer init time, system PNP init duration, user logon waiting time, critical services init time, and many others. You can see all these boot processing parameters and create a report in HTML format.

Free software to see Boot, Kernel, Drivers, Devices Init time in Windows 10:
BootPerformanceView is a simple tool and you can download it from here. After that, you just open it up and Zip archiver asks for a password then simply enter SoftNirPre987@. Next, it will automatically list all the boot processing parameters right in front of you. It will show you all the details and you can use it for auditing critical boot processes of your PC or server.

You can analyze the different boot parameters and then do whatever you want. But if you want to make a report of all the boot initialization times among other important parameters then you can easily do that. Just use the View menu of the software and then simply export all the items in HTML format.

If you want to audit the entire boot process then BootPerformanceView is a very nice tool. Every time you open after your PC boots or restarts, you will see a new entry as it uses Microsoft-Windows-Diagnostics-Performance/Operational event log to fetch the data. You can then analyze the different boot times and then see if there is any problem. If any module has init time more than expected then you further look into it manually and try to fix it.
Final words:
I found BootPerformanceView to be a very straightforward software that does what it says. There is no user input required and it works instantaneously. You just record the data that it shows, create a report, and then use that for analysis or benchmarking purposes. Also, it may help you uncover what boot processing modules are taking time longer than usual and then take further steps accordingly.