DataStation Application is a Free Open Source IDE Software that you can use to Query, Script and Visualize data from APIs and Databases. It also allows you to easily generate graphs pulled from databases
It allows you to easily build Graphs and Tables with data pulled from databases, warehouses, files, HTTP servers etc. and supports multiple scripting languages to create queries.
Features:
- Database Support: Fetch data from 18 SQL and non-SQL databases, HTTP servers, Rest APIs, Warehouses, text and binary files and more.
- Querying: Script (Query) against the data using Python, Ruby, PHP, JavaScript and other scripting languages.
- Visualization: Visualize your data using customizable graphs and charts.
- Cross Platform compatibility: The DataStation application works on multiple platforms such as Windows, macOS and Linux
The DataStation application uses a Panel for any work execution. For example, Database Panel allows you to fetch data from a database, File Panel is used to read data from file formats such as JSON, CSV etc., Code Panels allow you to Query your data and more.
How it Works:
1. Download and install the DataStation application from the link provided at the end of this article. You must ensure that you have a 64-bit operating system if you are using Windows.
2. Type the name of your Project, select ‘Blank, No Template’ from the drop down below it and click on ‘Go’.
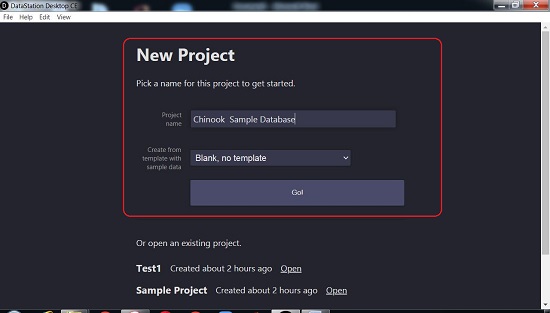
3. Click on ‘Add Data Source’ and select the Database, File, Warehouse etc. that you wish to connect to and assign an identifiable name to this source. Depending upon the Data Source, you will need to provide more information such as Hostname, Name of Table / Database, Username, Password, Filename etc to access the source. For my testing, I used an SQLite file from my local disk.
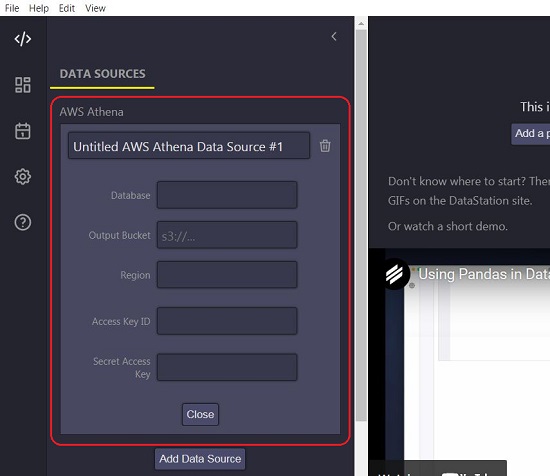

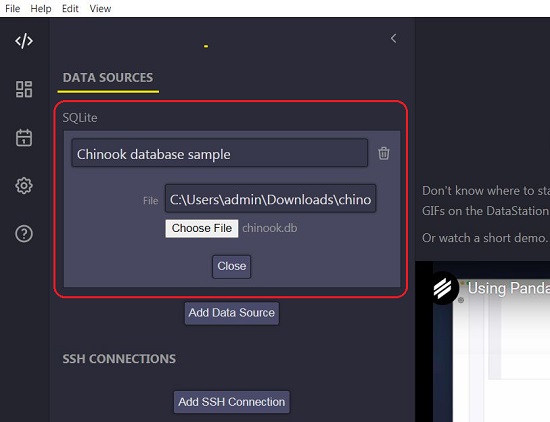
4. Click on ‘Add Page’ on the Panel at the right and give it a name. Click on ‘Add Panel’, select Import from ‘Database’, select the Data Source that you specified above and give a name to this panel.
5. You can now start running your Queries by typing the Code in this Panel. To execute the script, navigate to the right of the panel and click on the ‘Run’ icon or press Ctrl + Enter on your keyboard. The results can be previewed in the ‘Preview’ panel on the right.
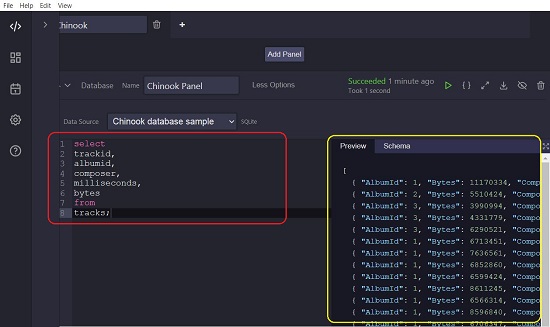
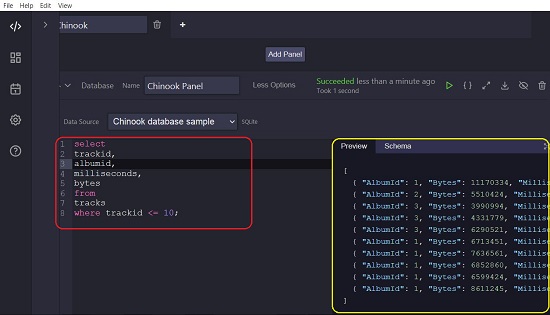
6. To save the results of your Query, click on the ‘Download’ in the Panel toolbar and select if you wish to save the results in a file or clipboard in the CSV, HTML, Markdown or JSON format.
7. To create a Table from the Query executed above, click on the ‘Table’ icon below the panel. You can download this table by clicking on the ‘Download’ icon in the toolbar.
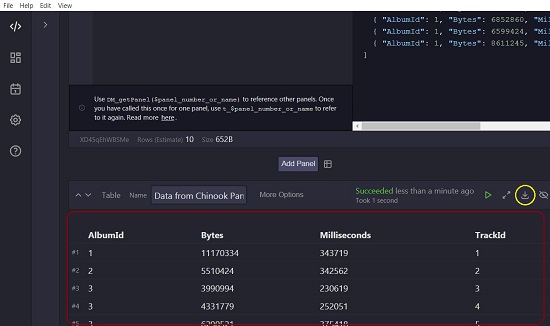
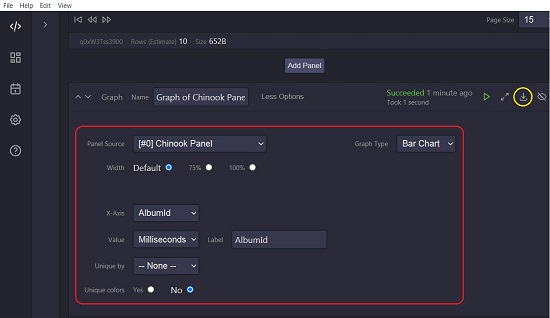
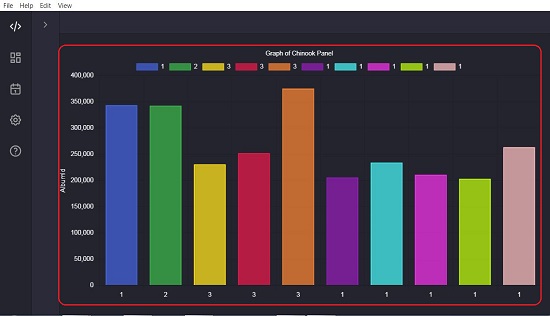
8. To visualize your data using a graph, scroll down and click on the ‘Graph’ icon below the panel. Alternatively, you can click on the ‘Add Panel’ button and choose ‘Visualize with – Graph’. Select the Panel Source, Graph Type, define the X and Y axis values and the width of the chart. The graph will be created and updated in real time as you make additional changes. You can download the graph in the PNG format by clicking on the ‘Download’ icon in the toolbar.
9. You can also use the Toolbar at the top of each panel to toggle full screen mode, hide / unhide the panel, delete the panel and more.
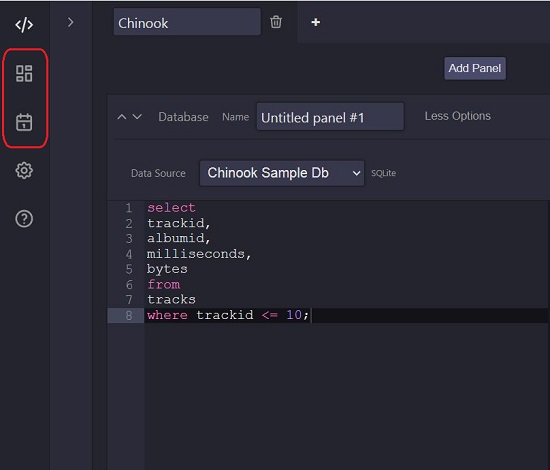
10. You can access the DataStation Dashboards, Export data etc using the vertical toolbar at the left of the interface. The DataStation Server must be up and running for this to work.
Downside:
The interface is not user friendly and at times it becomes difficult to navigate the different panels.
Verdict:
Overall, the DataStation application is a good software to connect to a variety of Data Sources like Databases, Files and Rest APIs to query data as well as visualize it in the form of different types of graphs.
Click here to navigate to DataStation and download the application depending on your operating system.